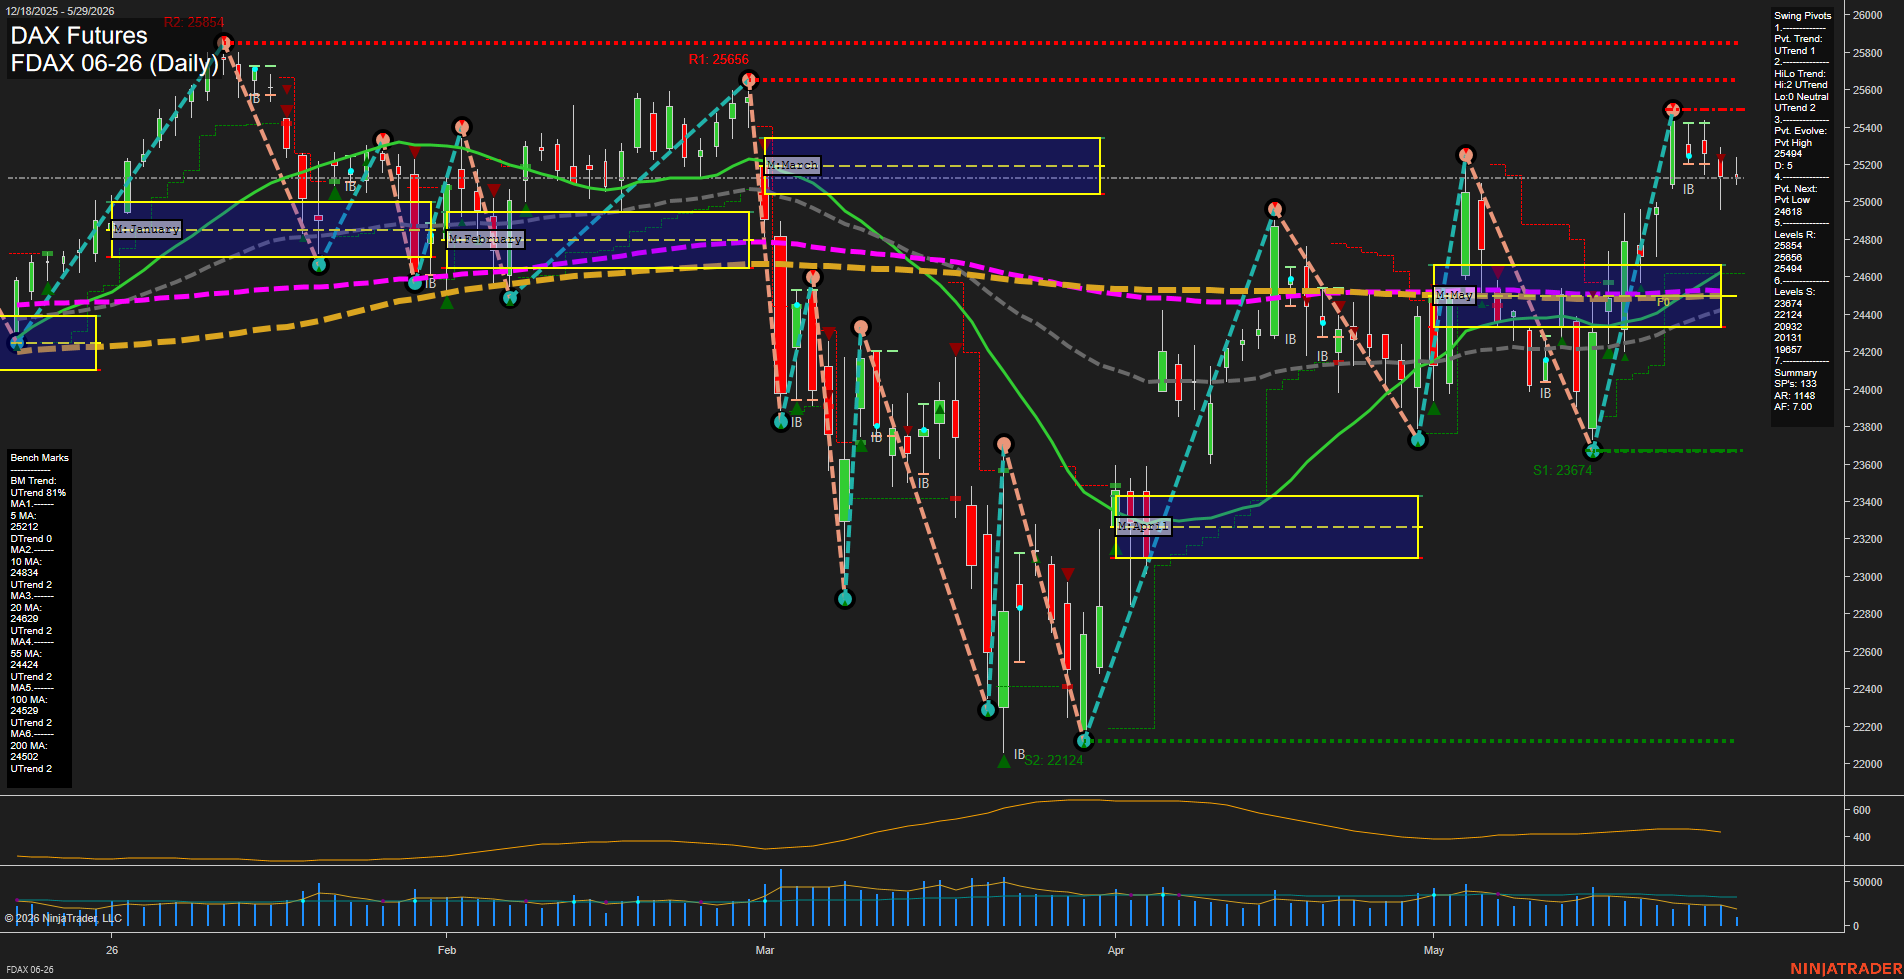
FDAX DAX Futures Daily Chart Analysis: 2026-May-29 07:03 CT
Price Action
- Last: 25100,
- Bars: Medium,
- Mom: average.
WSFG Weekly
- Short-Term
- WSFG Current: 4%
- F0%/NTZ' Bias: Price Above,
- WSFG Trend: Up.
MSFG Month May
- Intermediate-Term
- MSFG Current: 36%
- F0%/NTZ' Bias: Price Above,
- MSFG Trend: Up.
YSFG Year 2026
- Long-Term
- YSFG Current: 11%
- F0%/NTZ' Bias: Price Above,
- YSFG Trend: Up.
Swing Pivots
- (Short-Term) 1. Pvt. Trend: UTrend,
- (Intermediate-Term) 2. HiLo Trend: UTrend,
- 3. Pvt. Evolve: Pvt High 25494,
- 4. Pvt. Next: Pvt Low 24818,
- 5. Levels R: 25854, 25666, 25494,
- 6. Levels S: 23674, 22124, 20932, 20131, 19857.
Daily Benchmarks
- (Short-Term) 5 Day: 25212 Down Trend,
- (Short-Term) 10 Day: 24834 Up Trend,
- (Intermediate-Term) 20 Day: 24629 Up Trend,
- (Intermediate-Term) 55 Day: 24424 Up Trend,
- (Long-Term) 100 Day: 24529 Up Trend,
- (Long-Term) 200 Day: 24502 Up Trend.
Additional Metrics
Recent Trade Signals
- 28 May 2026: Short FDAX 06-26 @ 25099 Signals.USAR.TR120
- 25 May 2026: Long FDAX 06-26 @ 25226 Signals.USAR-WSFG
- 22 May 2026: Long FDAX 06-26 @ 24823 Signals.USAR-MSFG
Overall Rating
- Short-Term: Neutral,
- Intermediate-Term: Bullish,
- Long-Term: Bullish.
Key Insights Summary
DAX futures are holding an upward structural bias across weekly, monthly, and yearly session fib grids, with price sitting above the NTZ/F0% zones on all three time frames. Daily swing structure remains in an uptrend, but the latest action is trading below the 5-day benchmark while still supported by the 10-day and higher moving averages, which keeps the immediate posture mixed rather than fully impulsive. The pivot map shows resistance overhead at 25494, 25666, and 25854, while support is layered well below at 24818, 23674, and 22124. Recent trade signals reflect a fast rotation from long participation into a short signal near 25099, consistent with a market that has been rallying, consolidating, and testing prior resistance rather than trending in a clean straight line. From a swing-trader perspective, the larger pattern remains constructive, with the current phase shaped by digestion beneath nearby highs after a strong rebound from the April low.
Chart Analysis ATS AI Generated: 2026-05-29 07:03 for Informational use only, not trading advice. Terms and Risk Disclosure Copyright © 2026. Algo Trading Systems LLC.