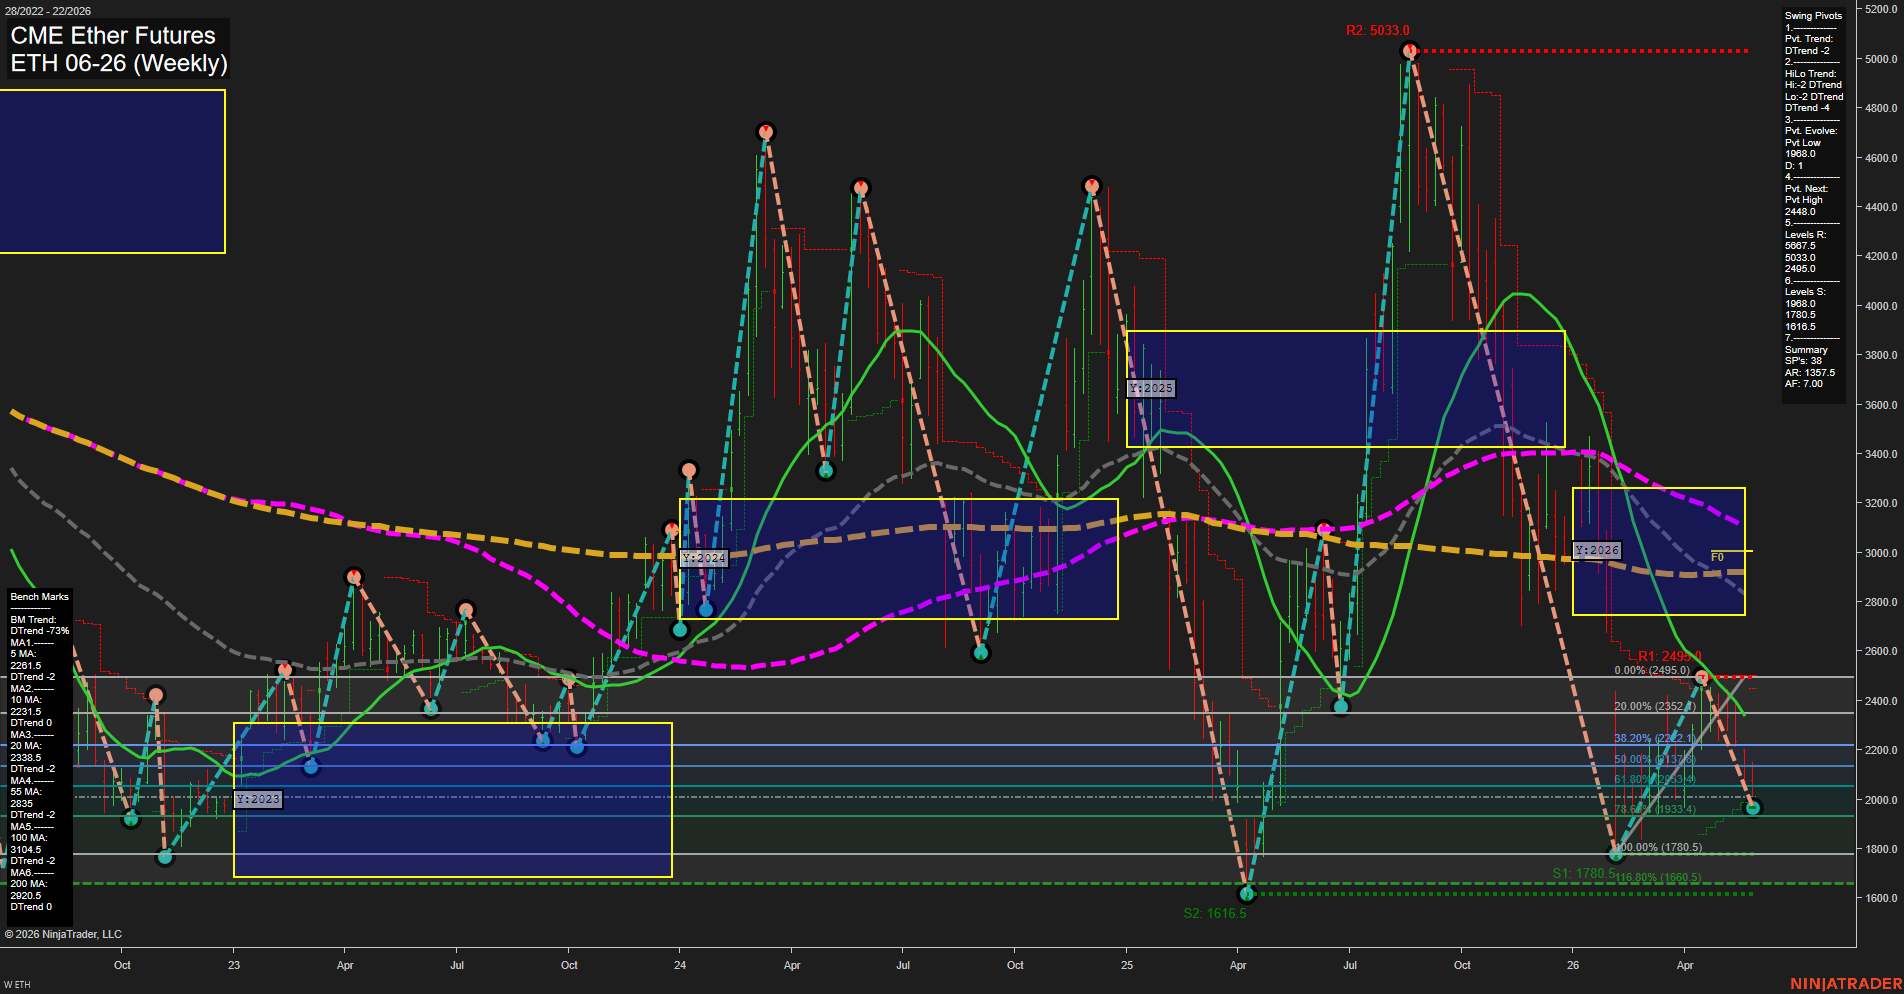
ETH CME Ether Futures Weekly Chart Analysis: 2026-May-29 07:03 CT
Price Action
- Last: 1968.0,
- Bars: Large,
- Mom: Fast.
WSFG Weekly
- Short-Term
- WSFG Current: -43%
- F0%/NTZ' Bias: Price Below,
- WSFG Trend: Down.
MSFG Month May
- Intermediate-Term
- MSFG Current: -61%
- F0%/NTZ' Bias: Price Below,
- MSFG Trend: Down.
YSFG Year 2026
- Long-Term
- YSFG Current: -39%
- F0%/NTZ' Bias: Price Below,
- YSFG Trend: Down.
Swing Pivots
- (Short-Term) 1. Pvt. Trend: DTrend,
- (Intermediate-Term) 2. HiLo Trend: DTrend,
- 3. Pvt. Evolve: Pvt Low 1968.0,
- 4. Pvt. Next: Pvt High 2448.0,
- 5. Levels R: 5687.5, 5033.0, 2495.0,
- 6. Levels S: 1988.0, 1780.5, 1616.5.
Weekly Benchmarks
- (Short-Term) 5 Day: 2261.5 Down Trend,
- (Short-Term) 10 Day: 2231.5 Down Trend,
- (Intermediate-Term) 20 Day: 2338.5 Down Trend,
- (Intermediate-Term) 55 Day: 2835.0 Down Trend,
- (Long-Term) 100 Day: 3104.5 Down Trend,
- (Long-Term) 200 Day: 2820.5 Down Trend.
Overall Rating
- Short-Term: Bearish,
- Intermediate-Term: Bearish,
- Long-Term: Bearish.
Key Insights Summary
Weekly ETH futures are in a broadly bearish swing structure with price pinned below the yearly, monthly, and weekly Fib grid midlines and with all benchmark averages stacked overhead and sloping lower. The short-term pivot structure remains in DTrend, and the active pivot sequence is still defined by a lower swing low at 1968.0 after a sharp selloff from the prior high near 2448.0. That keeps the recent tape aligned with downside continuation rather than a stable base. The current setup shows a compressed pullback beneath major retracement zones after a volatile multi-month decline, with repeated rejection from the upper Fib and moving-average bands. On the higher-timeframe view, the 2026 yearly grid is still below F0%, the May monthly grid is also below F0%, and the weekly grid remains negative, reinforcing a dominant lower-highs, lower-lows environment.
Chart Analysis ATS AI Generated: 2026-05-29 07:03 for Informational use only, not trading advice. Terms and Risk Disclosure Copyright © 2026. Algo Trading Systems LLC.