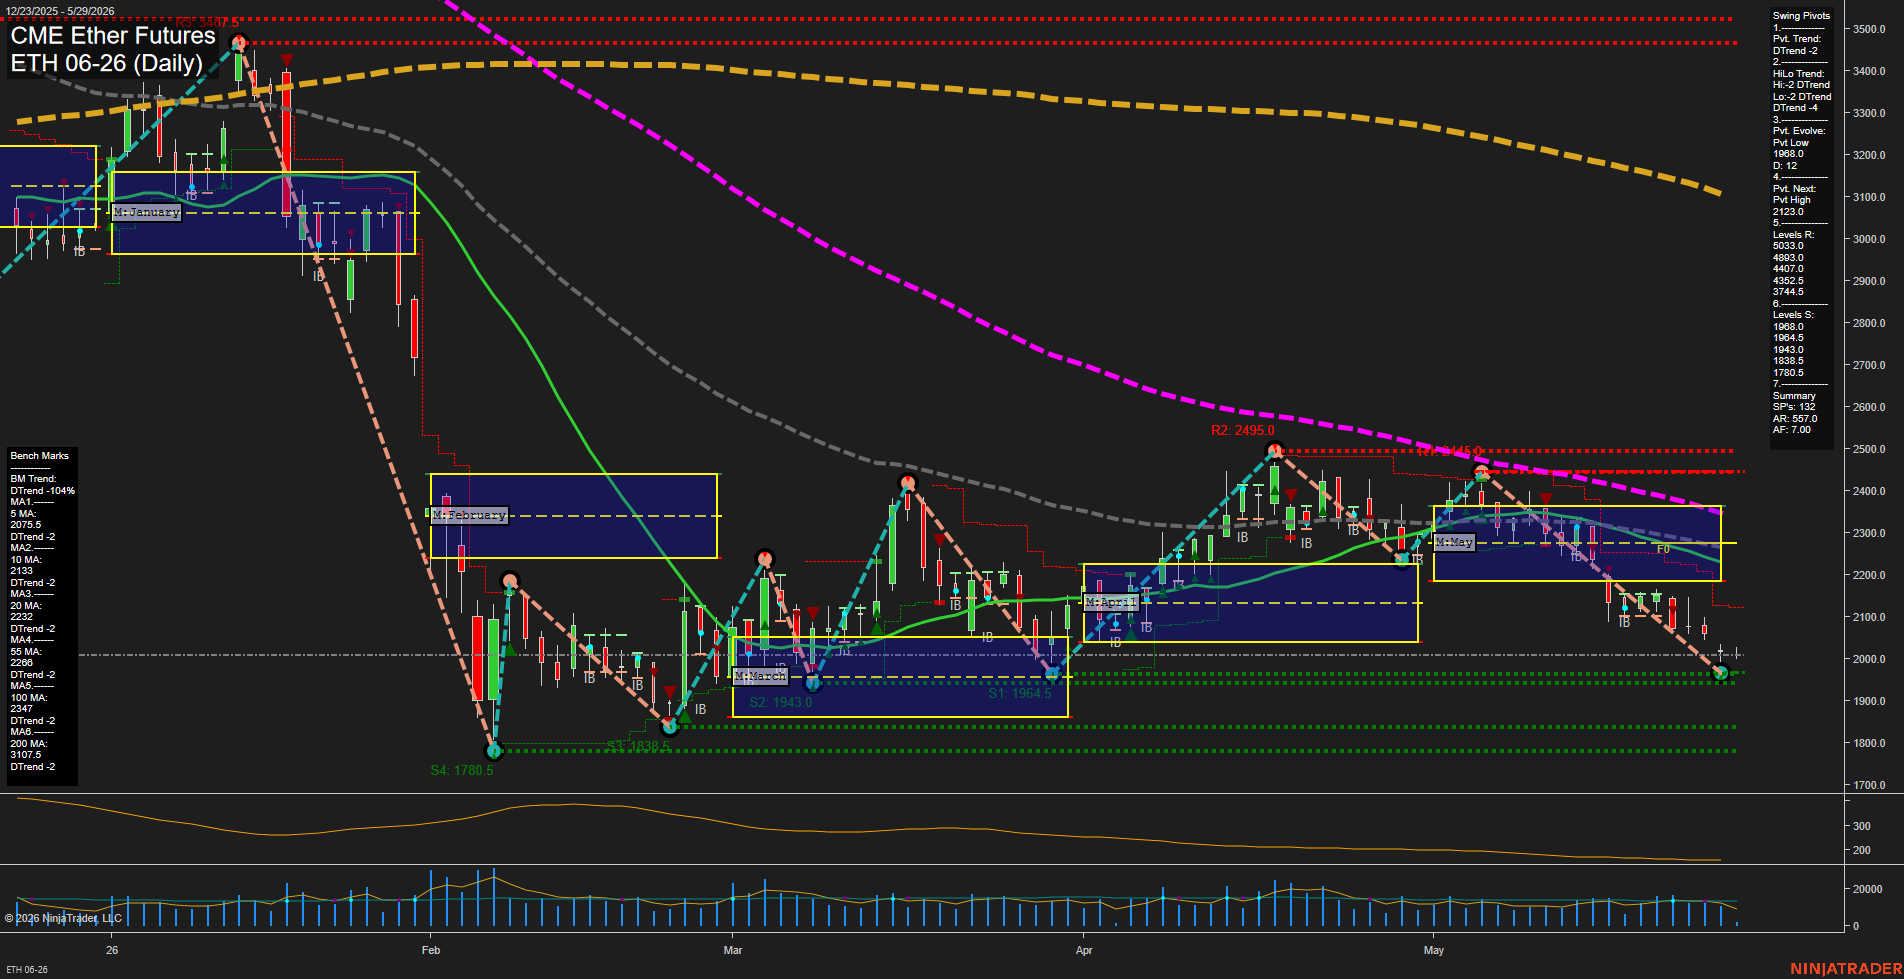
ETH CME Ether Futures Daily Chart Analysis: 2026-May-29 07:03 CT
Price Action
- Last: 1980.0,
- Bars: Large,
- Mom: fast.
WSFG Weekly
- Short-Term
- WSFG Current: -43%
- F0%/NTZ' Bias: Price Below,
- WSFG Trend: Down.
MSFG Month May
- Intermediate-Term
- MSFG Current: -61%
- F0%/NTZ' Bias: Price Below,
- MSFG Trend: Down.
YSFG Year 2026
- Long-Term
- YSFG Current: -39%
- F0%/NTZ' Bias: Price Below,
- YSFG Trend: Down.
Swing Pivots
- (Short-Term) 1. Pvt. Trend: DTrend,
- (Intermediate-Term) 2. HiLo Trend: DTrend,
- 3. Pvt. Evolve: Pvt Low 1968.0,
- 4. Pvt. Next: Pvt High 2123.0,
- 5. Levels R: 5033.0, 4893.0, 4407.0, 4352.5, 3744.5,
- 6. Levels S: 1968.0, 1964.5, 1943.0, 1838.5, 1780.5.
Daily Benchmarks
- (Short-Term) 5 Day: 2075.5 Down Trend,
- (Short-Term) 10 Day: 2133 Down Trend,
- (Intermediate-Term) 20 Day: 2232 Down Trend,
- (Intermediate-Term) 55 Day: 2286 Down Trend,
- (Long-Term) 100 Day: 2347 Down Trend,
- (Long-Term) 200 Day: 3107.5 Down Trend.
Additional Metrics
Overall Rating
- Short-Term: Bearish,
- Intermediate-Term: Bearish,
- Long-Term: Bearish.
Key Insights Summary
ETH CME Ether Futures is in a firm downside phase with price trading beneath all benchmark moving averages and below the monthly, weekly, and yearly fib grid midlines. The daily structure shows a sequence of lower highs and lower lows following the May rejection near the 2400-2500 area, with momentum accelerating into the current break toward the 1968 pivot support zone. Swing pivot trend is aligned bearish on both the short-term and intermediate-term readings, while the benchmark stack remains fully inverted, reinforcing downside control across multiple horizons. The chart reflects a selloff that has transitioned from a choppy consolidation into a more directional decline, with recent candles pressing into the lower support shelf after repeated failed recovery attempts from the April-May range.
Chart Analysis ATS AI Generated: 2026-05-29 07:03 for Informational use only, not trading advice. Terms and Risk Disclosure Copyright © 2026. Algo Trading Systems LLC.