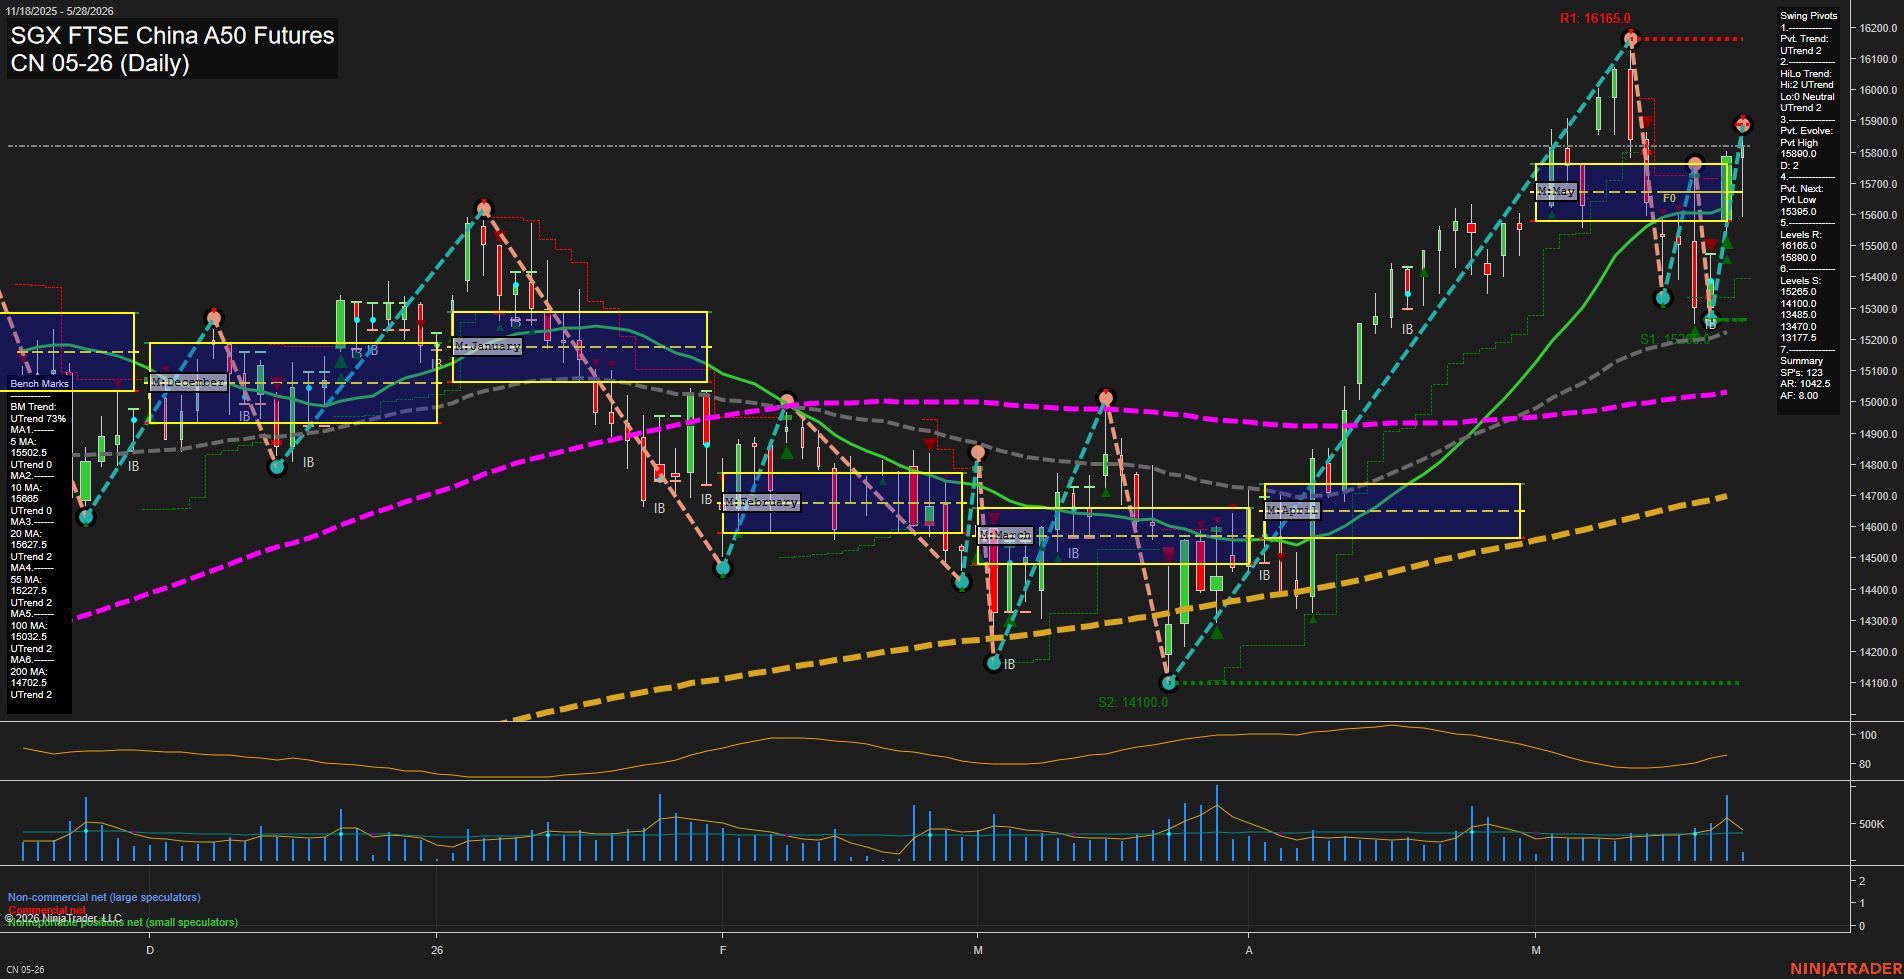
CN SGX FTSE China A50 Futures Daily Chart Analysis: 2026-May-29 07:02 CT
Price Action
- Last: 15890.0,
- Bars: Large,
- Mom: Fast.
WSFG Weekly
- Short-Term
- WSFG Current: NA%
- F0%/NTZ' Bias: Price Neutral,
- WSFG Trend: Neutral.
MSFG Month May
- Intermediate-Term
- MSFG Current: NA%
- F0%/NTZ' Bias: Price Neutral,
- MSFG Trend: Neutral.
YSFG Year 2026
- Long-Term
- YSFG Current: NA%
- F0%/NTZ' Bias: Price Neutral,
- YSFG Trend: Neutral.
Swing Pivots
- (Short-Term) 1. Pvt. Trend: UTrend,
- (Intermediate-Term) 2. HiLo Trend: UTrend,
- 3. Pvt. Evolve: Pvt High 15890.0,
- 4. Pvt. Next: Pvt Low 15395.0,
- 5. Levels R: 16165.0, 15890.0,
- 6. Levels S: 15285.0, 14100.0, 13485.0, 13470.0, 13177.5.
Daily Benchmarks
- (Short-Term) 5 Day: 15502.5 Up Trend,
- (Short-Term) 10 Day: 15865.0 Down Trend,
- (Intermediate-Term) 20 Day: 15027.5 Up Trend,
- (Intermediate-Term) 55 Day: 15227.5 Up Trend,
- (Long-Term) 100 Day: 15032.5 Up Trend,
- (Long-Term) 200 Day: 14702.5 Up Trend.
Additional Metrics
- ATR: 87.5,
- VOLMA: 261842.
Overall Rating
- Short-Term: Bullish,
- Intermediate-Term: Bullish,
- Long-Term: Bullish.
Key Insights Summary
The daily structure shows a strong recovery from the mid-month selloff and a fast rebound back into the upper May session band near 15890.0, leaving price positioned close to the upper end of the monthly range and under the 16165.0 resistance pivot. Swing pivots remain in UTrend, with the most recent pivot evolution still reflecting a high in force and the next reversal reference marked by the 15395.0 low. The benchmark stack is broadly supportive of the broader trend, with price above the 20, 55, 100, and 200 day averages, while the 10 day average remains above price and acts as the main nearby contrast. Volatility is elevated enough to keep the recent move visually impulsive rather than orderly, and the chart still reflects a sequence of sharp swings, inside-bar pauses, and quick rejection/reclaim behavior inside the wider uptrend.
Chart Analysis ATS AI Generated: 2026-05-29 07:02 for Informational use only, not trading advice. Terms and Risk Disclosure Copyright © 2026. Algo Trading Systems LLC.