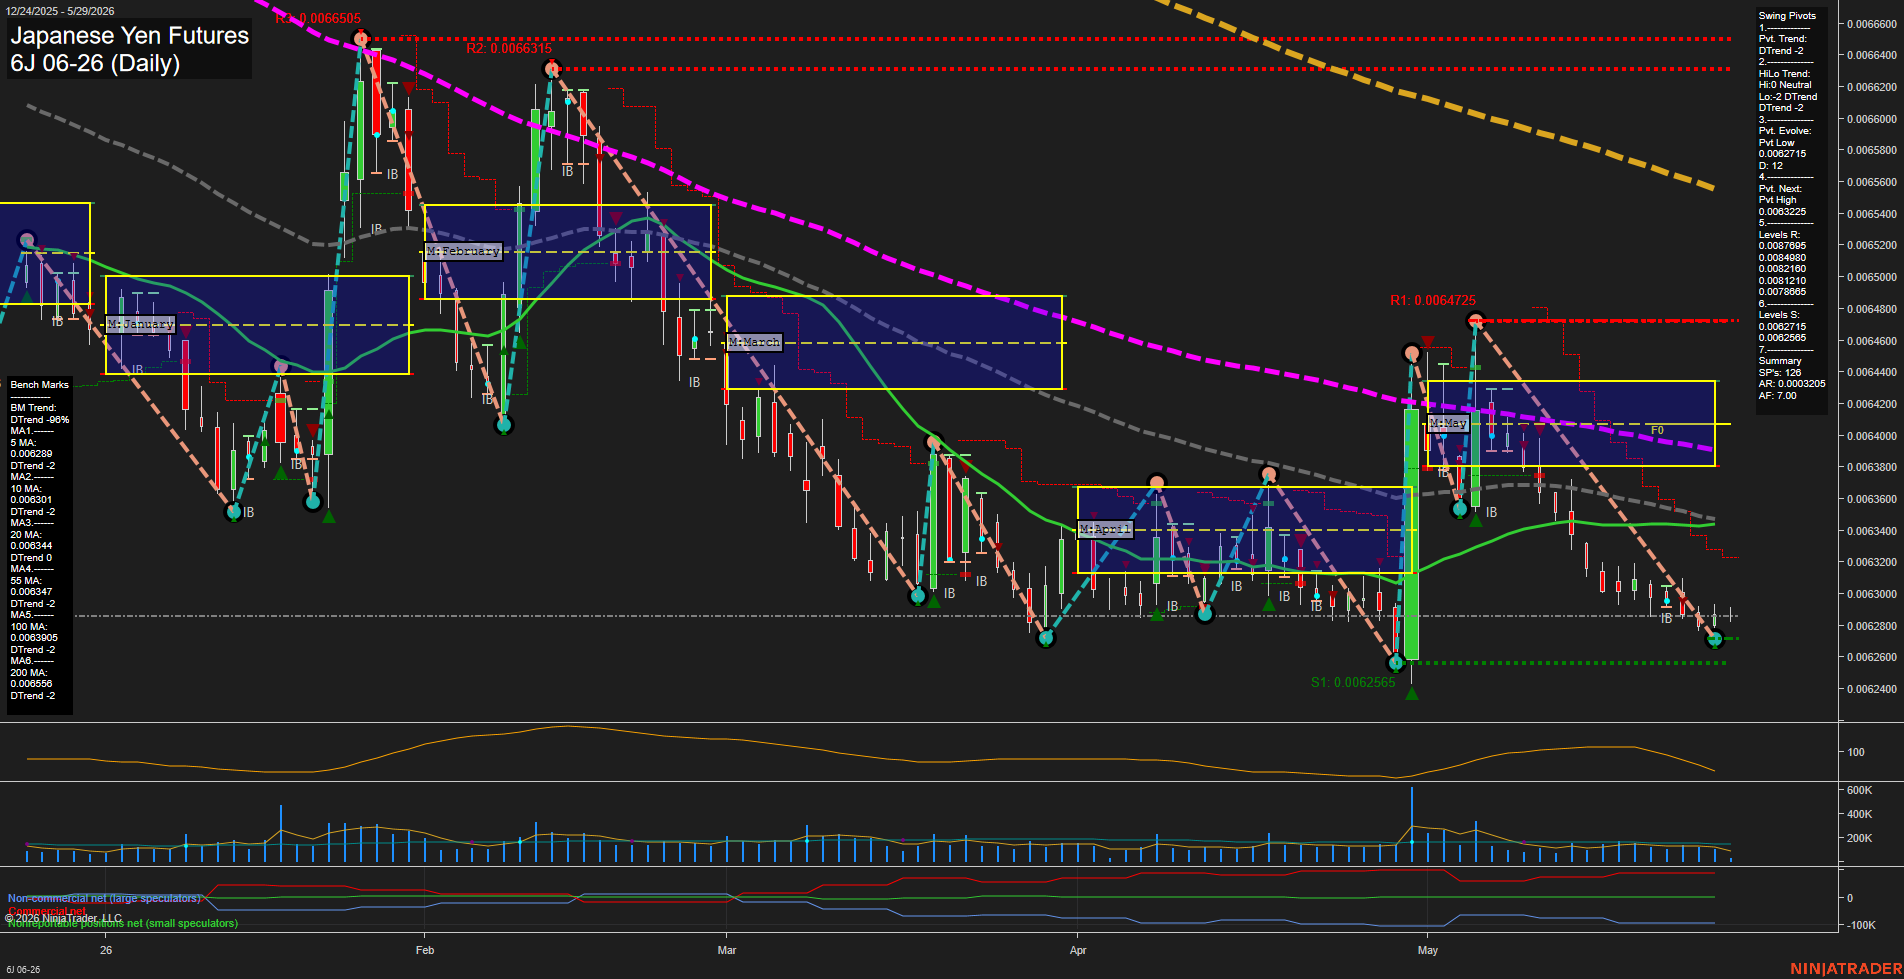
6J Japanese Yen Futures Daily Chart Analysis: 2026-May-29 07:01 CT
Price Action
- Last: 0.006285,
- Bars: Medium,
- Mom: slow.
WSFG Weekly
- Short-Term
- WSFG Current: -12%
- F0%/NTZ' Bias: Price Below,
- WSFG Trend: Down.
MSFG Month May
- Intermediate-Term
- MSFG Current: -54%
- F0%/NTZ' Bias: Price Below,
- MSFG Trend: Down.
YSFG Year 2026
- Long-Term
- YSFG Current: -15%
- F0%/NTZ' Bias: Price Below,
- YSFG Trend: Down.
Swing Pivots
- (Short-Term) 1. Pvt. Trend: DTrend,
- (Intermediate-Term) 2. HiLo Trend: DTrend,
- 3. Pvt. Evolve: Pvt Low 0.0062715,
- 4. Pvt. Next: Pvt High 0.0063225,
- 5. Levels R: 0.0067895, 0.0064980, 0.0064260, 0.0061210,
- 6. Levels S: 0.0062715, 0.0062565.
Daily Benchmarks
- (Short-Term) 5 Day: 0.0062895 Down Trend,
- (Short-Term) 10 Day: 0.006301 Down Trend,
- (Intermediate-Term) 20 Day: 0.006344 Down Trend,
- (Intermediate-Term) 55 Day: 0.006347 Down Trend,
- (Long-Term) 100 Day: 0.0063905 Down Trend,
- (Long-Term) 200 Day: 0.006556 Down Trend.
Additional Metrics
Recent Trade Signals
- 28 May 2026: Long 6J 06-26 @ 0.0062895 Signals.USAR.TR120
- 28 May 2026: Short 6J 06-26 @ 0.0062795 Signals.USAR-WSFG
Overall Rating
- Short-Term: Bearish,
- Intermediate-Term: Bearish,
- Long-Term: Bearish.
Key Insights Summary
Price remains pinned below the weekly, monthly, and yearly F0%/NTZ reference zones, keeping the broader structure aligned with the dominant downtrend. The daily benchmark stack is bearish across all major moving averages, with price trading under the 5, 10, 20, 55, 100, and 200-day measures, confirming persistent downside control. Swing pivot structure also remains negative, with DTrend readings on both the pivot and HiLo trend summaries, while the next pivot point sits above current price, reflecting a market that is still working through lower-high, lower-low behavior. The chart shows a recent sharp rejection from the May session area back into weakness, with intraday volatility expanding but follow-through still favoring the sellers. The overall pattern is a bearish consolidation-to-trend continuation profile, with price compressing near the lower end of the recent range after repeated tests and rejections beneath overhead resistance.
Chart Analysis ATS AI Generated: 2026-05-29 07:01 for Informational use only, not trading advice. Terms and Risk Disclosure Copyright © 2026. Algo Trading Systems LLC.