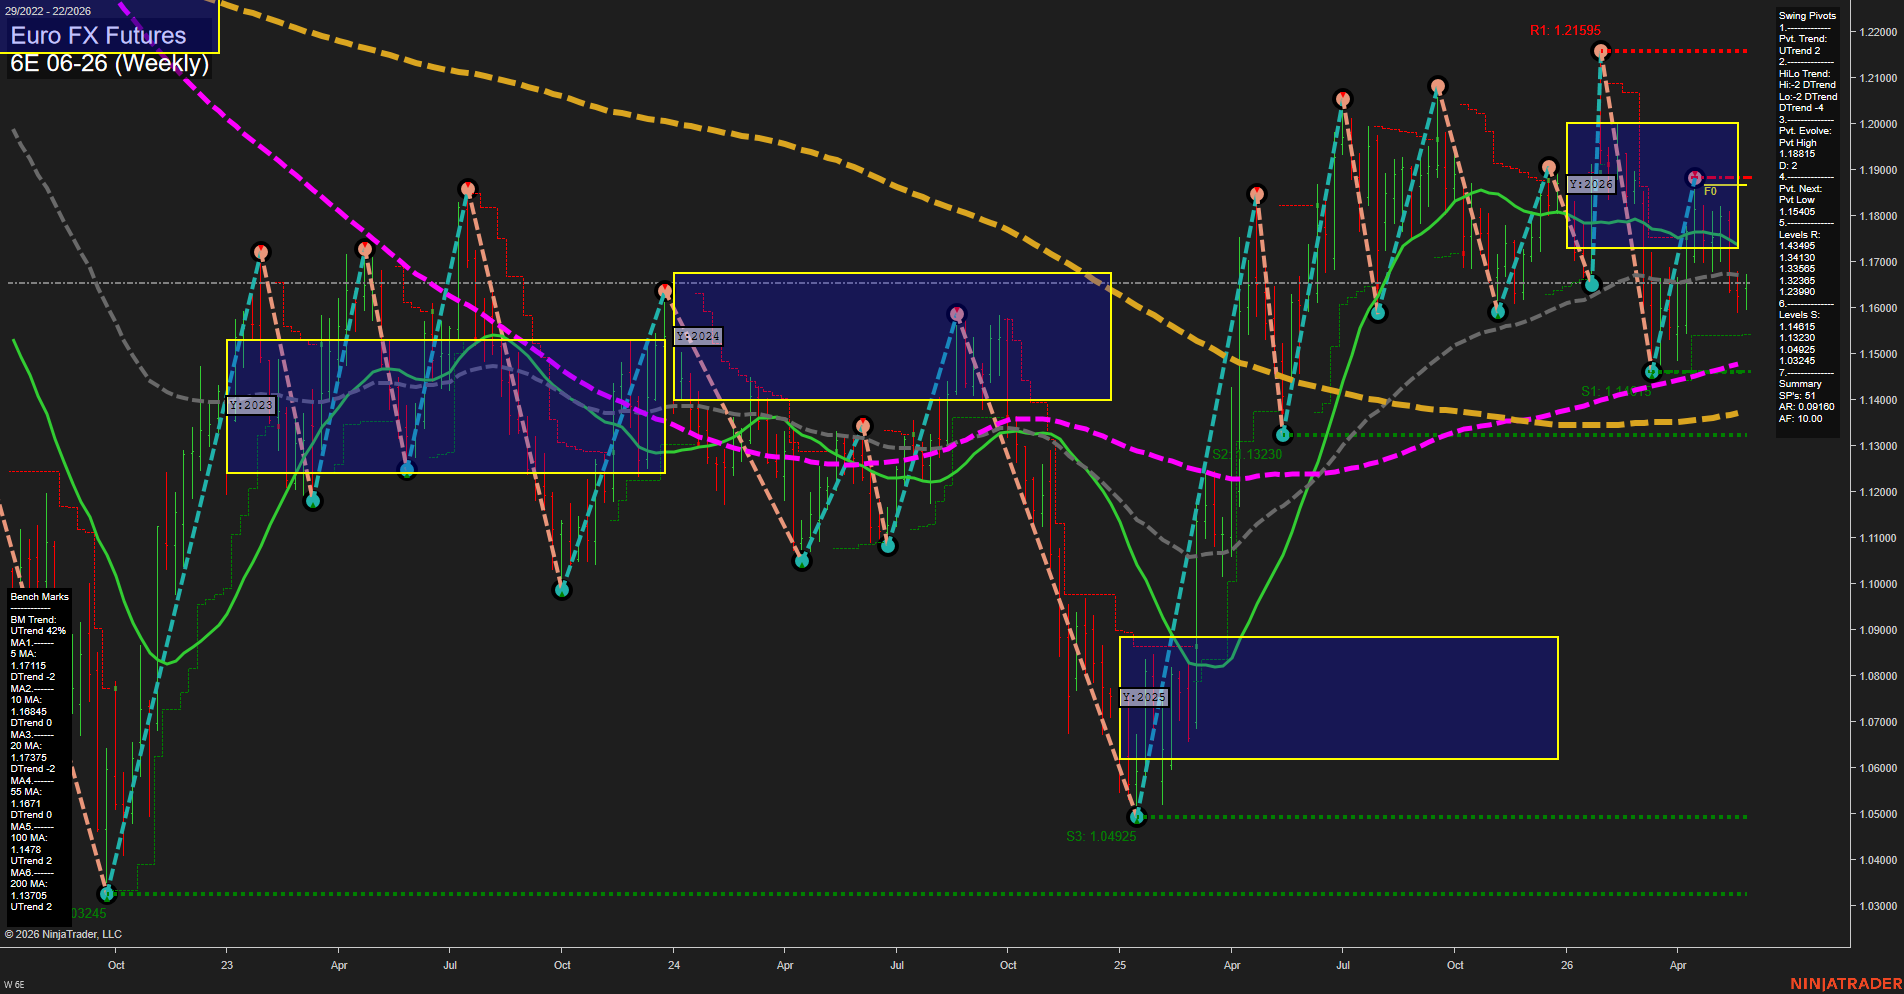
6E Euro FX Futures Weekly Chart Analysis: 2026-May-29 07:00 CT
Price Action
- Last: 1.16595,
- Bars: Medium,
- Mom: average.
WSFG Weekly
- Short-Term
- WSFG Current: 11%
- F0%/NTZ' Bias: Price Above,
- WSFG Trend: Up.
MSFG Month May
- Intermediate-Term
- MSFG Current: -37%
- F0%/NTZ' Bias: Price Below,
- MSFG Trend: Down.
YSFG Year 2026
- Long-Term
- YSFG Current: -16%
- F0%/NTZ' Bias: Price Below,
- YSFG Trend: Down.
Swing Pivots
- (Short-Term) 1. Pvt. Trend: UTrend,
- (Intermediate-Term) 2. HiLo Trend: DTrend,
- 3. Pvt. Evolve: Pvt High 1.18815,
- 4. Pvt. Next: Pvt Low 1.15405,
- 5. Levels R: 1.43495, 1.34130, 1.33585, 1.32365, 1.23990,
- 6. Levels S: 1.14615, 1.13230, 1.04925.
Weekly Benchmarks
- (Short-Term) 5 Day: 1.17115 Down Trend,
- (Short-Term) 10 Day: 1.16845 Down Trend,
- (Intermediate-Term) 20 Day: 1.17375 Down Trend,
- (Intermediate-Term) 55 Day: 1.16710 Down Trend,
- (Long-Term) 100 Day: 1.14780 Up Trend,
- (Long-Term) 200 Day: 1.13705 Up Trend.
Recent Trade Signals
- 29 May 2026: Long 6E 06-26 @ 1.16565 Signals.USAR-WSFG
- 28 May 2026: Long 6E 06-26 @ 1.1662 Signals.USAR.TR120
Overall Rating
- Short-Term: Bullish,
- Intermediate-Term: Bearish,
- Long-Term: Neutral.
Key Insights Summary
Weekly structure is holding an upward swing pivot trend with price trading above the weekly F0%/NTZ area, which keeps the short-term tone constructive. The monthly and yearly session grids remain below their midlines, showing that the broader backdrop is still under pressure and has not fully reversed from the prior weakness. Price is sitting under the 5, 10, 20, and 55-day benchmarks, so the medium-term trend remains compressed and below the near-term moving-average cluster, while the 100 and 200-day benchmarks still point higher and reflect an intact longer-cycle base. The swing pivot map shows a higher-level rally off the 2025 low, but the intermediate hi-lo trend is still in a corrective/down state, suggesting a market that is rebounding inside a larger uneven transition rather than cleanly trending in one direction. Recent long signals align with the weekly recovery, and the chart is in a choppy consolidation-to-recovery phase with repeated test-and-rejection swings around prior highs and the 1.16 area.
Chart Analysis ATS AI Generated: 2026-05-29 07:01 for Informational use only, not trading advice. Terms and Risk Disclosure Copyright © 2026. Algo Trading Systems LLC.