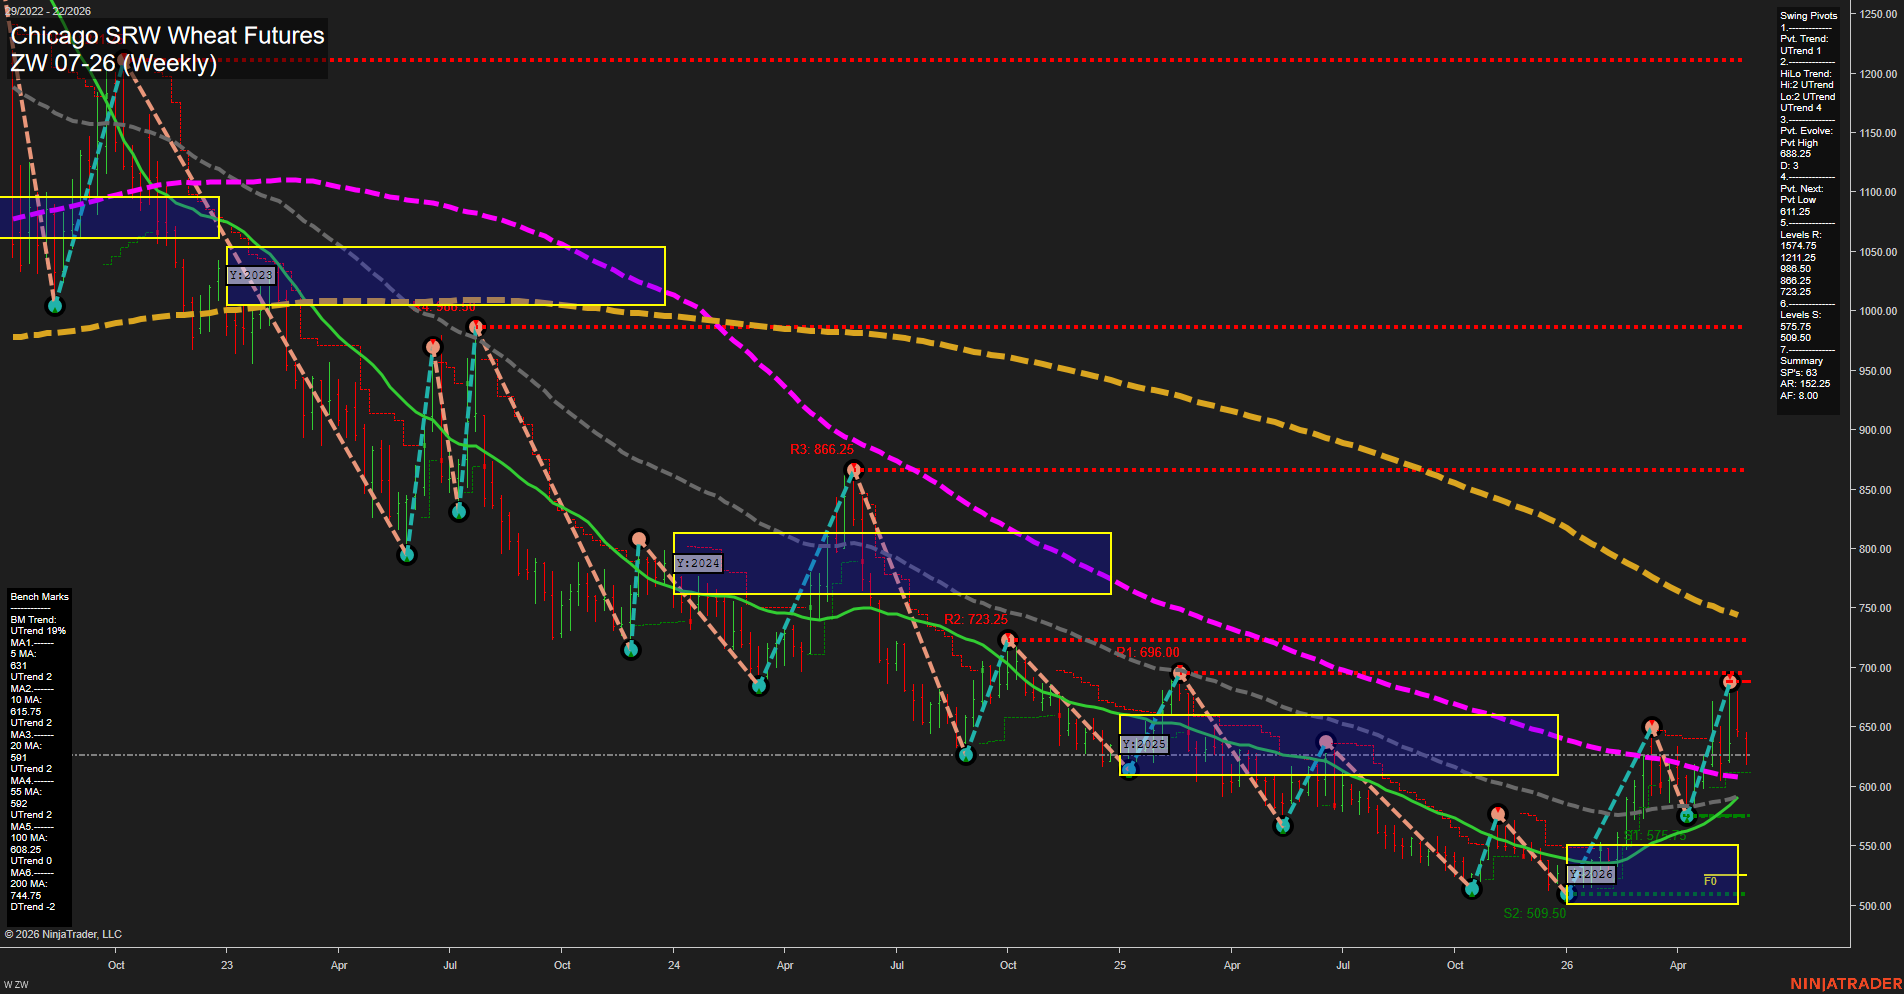
ZW Chicago SRW Wheat Futures Weekly Chart Analysis: 2026-May-28 07:10 CT
Price Action
- Last: 688.25,
- Bars: Large,
- Mom: Fast.
WSFG Weekly
- Short-Term
- WSFG Current: -28%
- F0%/NTZ' Bias: Price Below,
- WSFG Trend: Down.
MSFG Month May
- Intermediate-Term
- MSFG Current: -24%
- F0%/NTZ' Bias: Price Below,
- MSFG Trend: Down.
YSFG Year 2026
- Long-Term
- YSFG Current: 40%
- F0%/NTZ' Bias: Price Above,
- YSFG Trend: Up.
Swing Pivots
- (Short-Term) 1. Pvt. Trend: UTrend,
- (Intermediate-Term) 2. HiLo Trend: UTrend,
- 3. Pvt. Evolve: Pvt High 688.25,
- 4. Pvt. Next: Pvt Low 611.25,
- 5. Levels R: 1574.75, 1211.25, 868.50, 806.25, 723.25,
- 6. Levels S: 575.75, 509.50.
Weekly Benchmarks
- (Short-Term) 5 Day: 631.00 Up Trend,
- (Short-Term) 10 Day: 615.75 Up Trend,
- (Intermediate-Term) 20 Day: 591.00 Up Trend,
- (Intermediate-Term) 55 Day: 592.00 Up Trend,
- (Long-Term) 100 Day: 608.25 Up Trend,
- (Long-Term) 200 Day: 744.75 Down Trend.
Recent Trade Signals
- 27 May 2026: Short ZW 07-26 @ 624.25 Signals.USAR.TR720
- 27 May 2026: Short ZW 07-26 @ 631.75 Signals.USAR-MSFG
- 21 May 2026: Short ZW 07-26 @ 652.5 Signals.USAR.TR120
Overall Rating
- Short-Term: Bullish,
- Intermediate-Term: Bearish,
- Long-Term: Bullish.
Key Insights Summary
Wheat is staging a sharp weekly rebound from the 2026 lows, with a large impulse bar pushing price back up toward 688.25 and above the 5, 10, 20, 55, and 100 day benchmarks. That leaves the short-term swing structure constructive even though the weekly and monthly session fib grids remain below their F0% centers and still print a down bias. The pivot sequence has turned back to UTrend, but the next meaningful pivot reference remains a lower swing low at 611.25, which keeps the broader recovery framework intact but not yet fully resolved. The 2026 yearly fib grid is still positive and price is above its F0%/NTZ center, supporting a long-term recovery tone, while the 200 day average continues to lean lower and stands as the major overhead trend reference. Recent short signals from late May reflect the earlier downtrend and failed rally phases, but the latest price action shows a strong counter-trend bounce and a possible transition from deep selloff conditions into a broader consolidation-and-rebound phase.
Chart Analysis ATS AI Generated: 2026-05-28 07:10 for Informational use only, not trading advice. Terms and Risk Disclosure Copyright © 2026. Algo Trading Systems LLC.