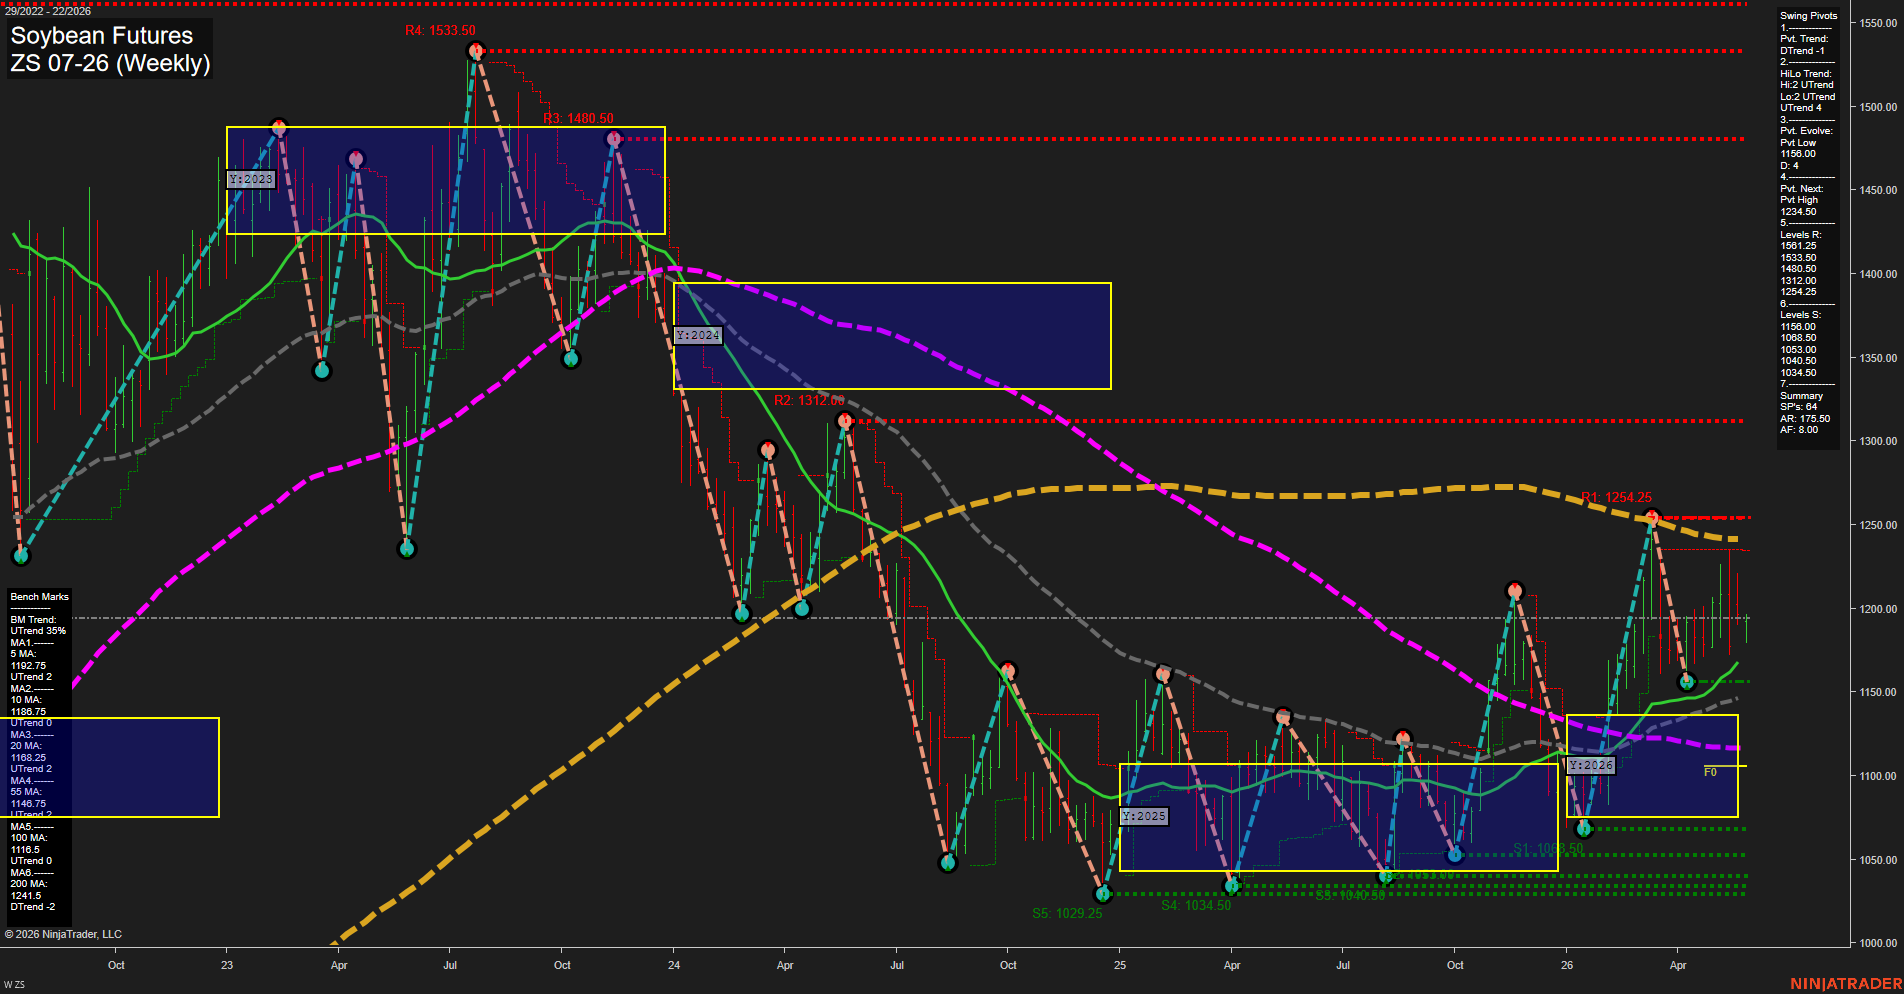
ZS Soybean Futures Weekly Chart Analysis: 2026-May-28 07:09 CT
Price Action
- Last: 1192.75,
- Bars: Medium,
- Mom: average.
WSFG Weekly
- Short-Term
- WSFG Current: 6%
- F0%/NTZ' Bias: Price Above,
- WSFG Trend: Up.
MSFG Month May
- Intermediate-Term
- MSFG Current: -12%
- F0%/NTZ' Bias: Price Below,
- MSFG Trend: Down.
YSFG Year 2026
- Long-Term
- YSFG Current: 29%
- F0%/NTZ' Bias: Price Above,
- YSFG Trend: Up.
Swing Pivots
- (Short-Term) 1. Pvt. Trend: DTrend,
- (Intermediate-Term) 2. HiLo Trend: UTrend,
- 3. Pvt. Evolve: Pvt Low 1158.00,
- 4. Pvt. Next: Pvt High 1234.50,
- 5. Levels R: 1561.25, 1533.50, 1480.50, 1312.00, 1254.25,
- 6. Levels S: 1158.00, 1068.50, 1053.00, 1040.50, 1034.50, 1029.25.
Weekly Benchmarks
- (Short-Term) 5 Day: 1192.75 Up Trend,
- (Short-Term) 10 Day: 1186.75 Up Trend,
- (Intermediate-Term) 20 Day: 1168.25 Up Trend,
- (Intermediate-Term) 55 Day: 1146.75 Up Trend,
- (Long-Term) 100 Day: 1116.50 Up Trend,
- (Long-Term) 200 Day: 1241.50 Down Trend.
Recent Trade Signals
- 28 May 2026: Short ZS 07-26 @ 1192 Signals.USAR-MSFG
- 27 May 2026: Short ZS 07-26 @ 1185.75 Signals.USAR-WSFG
- 20 May 2026: Short ZS 07-26 @ 1197.5 Signals.USAR.TR120
Overall Rating
- Short-Term: Bullish,
- Intermediate-Term: Bearish,
- Long-Term: Bullish.
Key Insights Summary
soybean futures are working through a mixed but constructive recovery phase after a broad decline from the 2024 highs. The weekly structure shows price holding above the 5/10/20/55 and 100-day benchmarks, which keeps the shorter and medium swing backdrop firm even as the 200-day remains overhead and declining. The weekly swing pivot trend is still in a down phase, so the market is not yet fully repaired; however, the HiLo trend turning up and the price sitting above the weekly and yearly fib midlines show improving participation. The monthly session fib bias remains below its zero line, which explains the persistent intermediate-term selling pressure and the recent short signals. Overall, the chart reads like a base-and-rebound environment with overhead resistance still layered at 1254.25 and 1312.00, while support is being defined by the 1158.00 pivot and the low 1060s to 1030s zone.
Chart Analysis ATS AI Generated: 2026-05-28 07:09 for Informational use only, not trading advice. Terms and Risk Disclosure Copyright © 2026. Algo Trading Systems LLC.