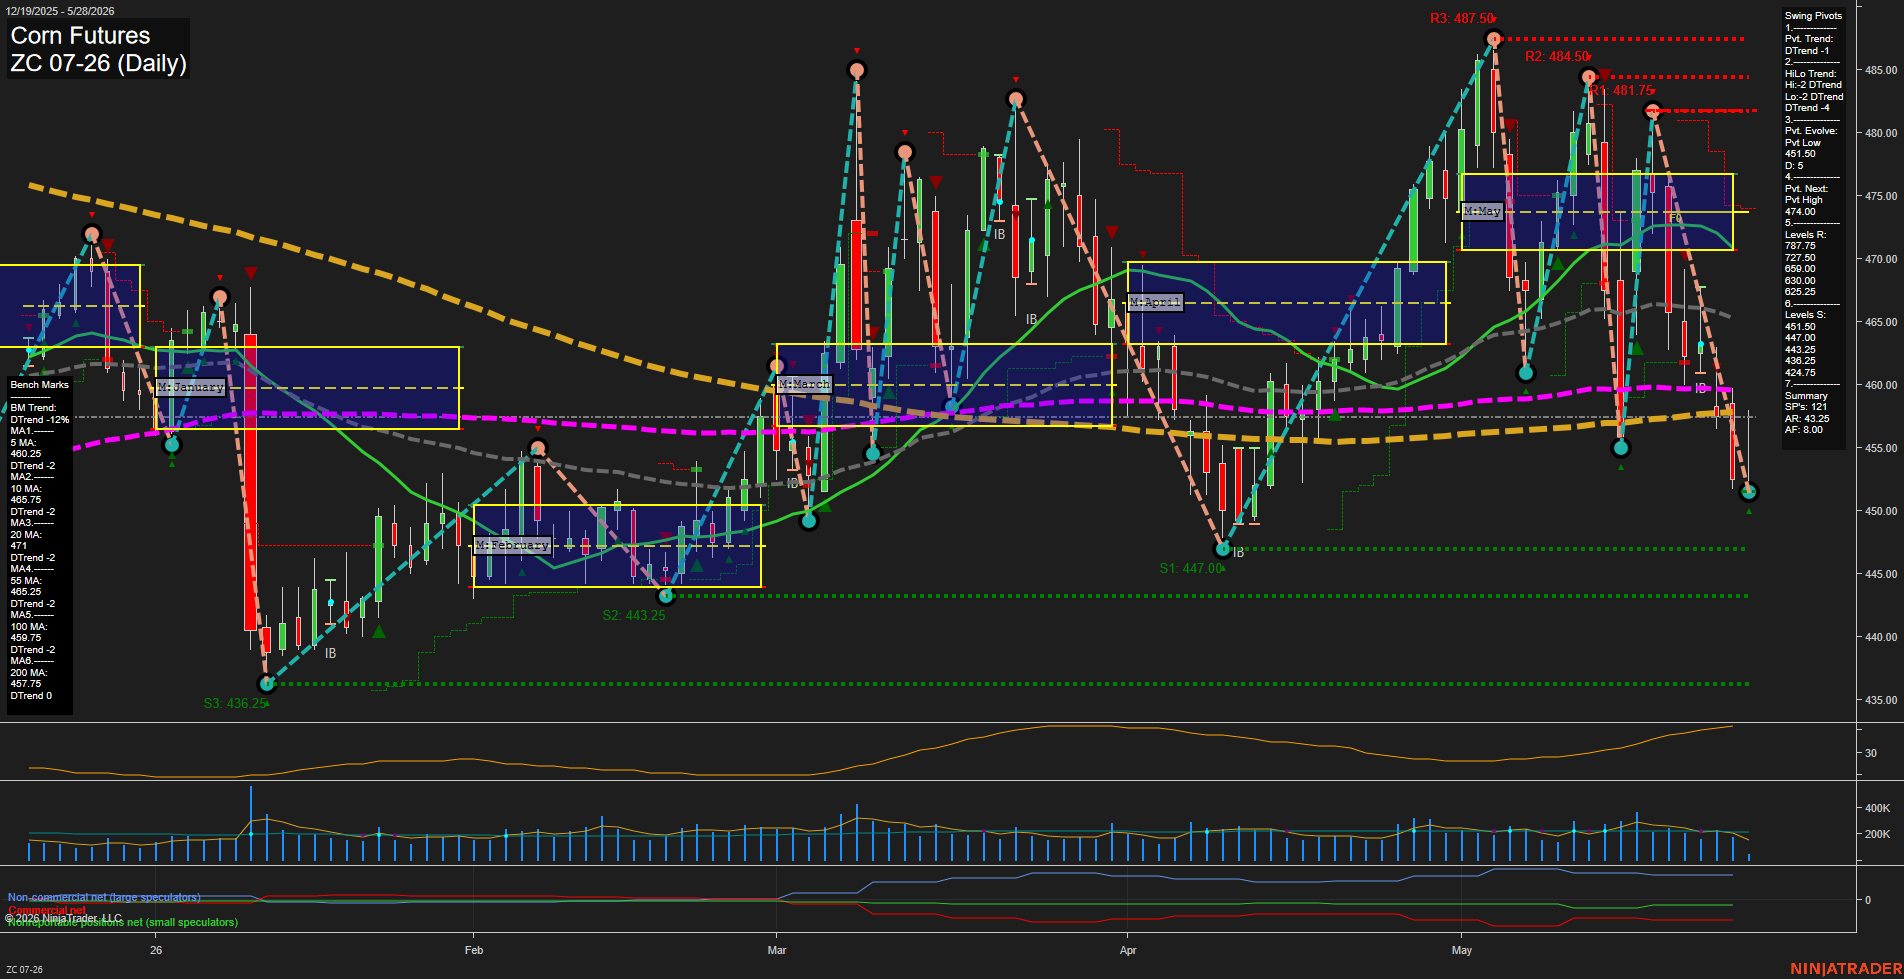
ZC Corn Futures Daily Chart Analysis: 2026-May-28 07:09 CT
Price Action
- Last: 455.50,
- Bars: Large,
- Mom: fast.
WSFG Weekly
- Short-Term
- WSFG Current: -3%
- F0%/NTZ' Bias: Price Below,
- WSFG Trend: Down.
MSFG Month May
- Intermediate-Term
- MSFG Current: -86%
- F0%/NTZ' Bias: Price Below,
- MSFG Trend: Down.
YSFG Year 2026
- Long-Term
- YSFG Current: -7%
- F0%/NTZ' Bias: Price Below,
- YSFG Trend: Down.
Swing Pivots
- (Short-Term) 1. Pvt. Trend: DTrend-1,
- (Intermediate-Term) 2. HiLo Trend: DTrend-2,
- 3. Pvt. Evolve: Pvt Low 451.50,
- 4. Pvt. Next: Pvt High 474.00,
- 5. Levels R: 787.75, 727.50, 659.00, 630.00, 625.25,
- 6. Levels S: 451.50, 447.00, 443.25, 438.25, 424.75.
Daily Benchmarks
- (Short-Term) 5 Day: 460.25 Down Trend,
- (Short-Term) 10 Day: 465.75 Down Trend,
- (Intermediate-Term) 20 Day: 471.00 Down Trend,
- (Intermediate-Term) 55 Day: 465.25 Down Trend,
- (Long-Term) 100 Day: 459.75 Down Trend,
- (Long-Term) 200 Day: 457.75 Up Trend.
Additional Metrics
Recent Trade Signals
- 28 May 2026: Short ZC 07-26 @ 455.5 Signals.USAR-WSFG
- 20 May 2026: Short ZC 07-26 @ 463.75 Signals.USAR.TR120
Overall Rating
- Short-Term: Bearish,
- Intermediate-Term: Bearish,
- Long-Term: Bearish.
Key Insights Summary
Corn futures are in a clear downside phase with the latest selloff pushing price back under the 5, 10, 20, 55, and 100-day benchmarks, while the 200-day sits only modestly below current trade. Weekly, monthly, and yearly session fib grids all show price below the F0%/NTZ zone, reinforcing a broad downside bias. Swing structure has rolled into a short-term downtrend with the next pivot evolution marked as a pivot low at 451.50, and support levels stacked just beneath the market near 451.50, 447.00, and 443.25. The chart shows repeated expansion and rejection swings from the May high area, with momentum now aligned to the downside after a large-range red continuation day and a fresh short trade signal. Overall structure favors a bearish swing-trader read across all time horizons, with price acting below key trend references and still inside an active decline sequence.
Chart Analysis ATS AI Generated: 2026-05-28 07:09 for Informational use only, not trading advice. Terms and Risk Disclosure Copyright © 2026. Algo Trading Systems LLC.