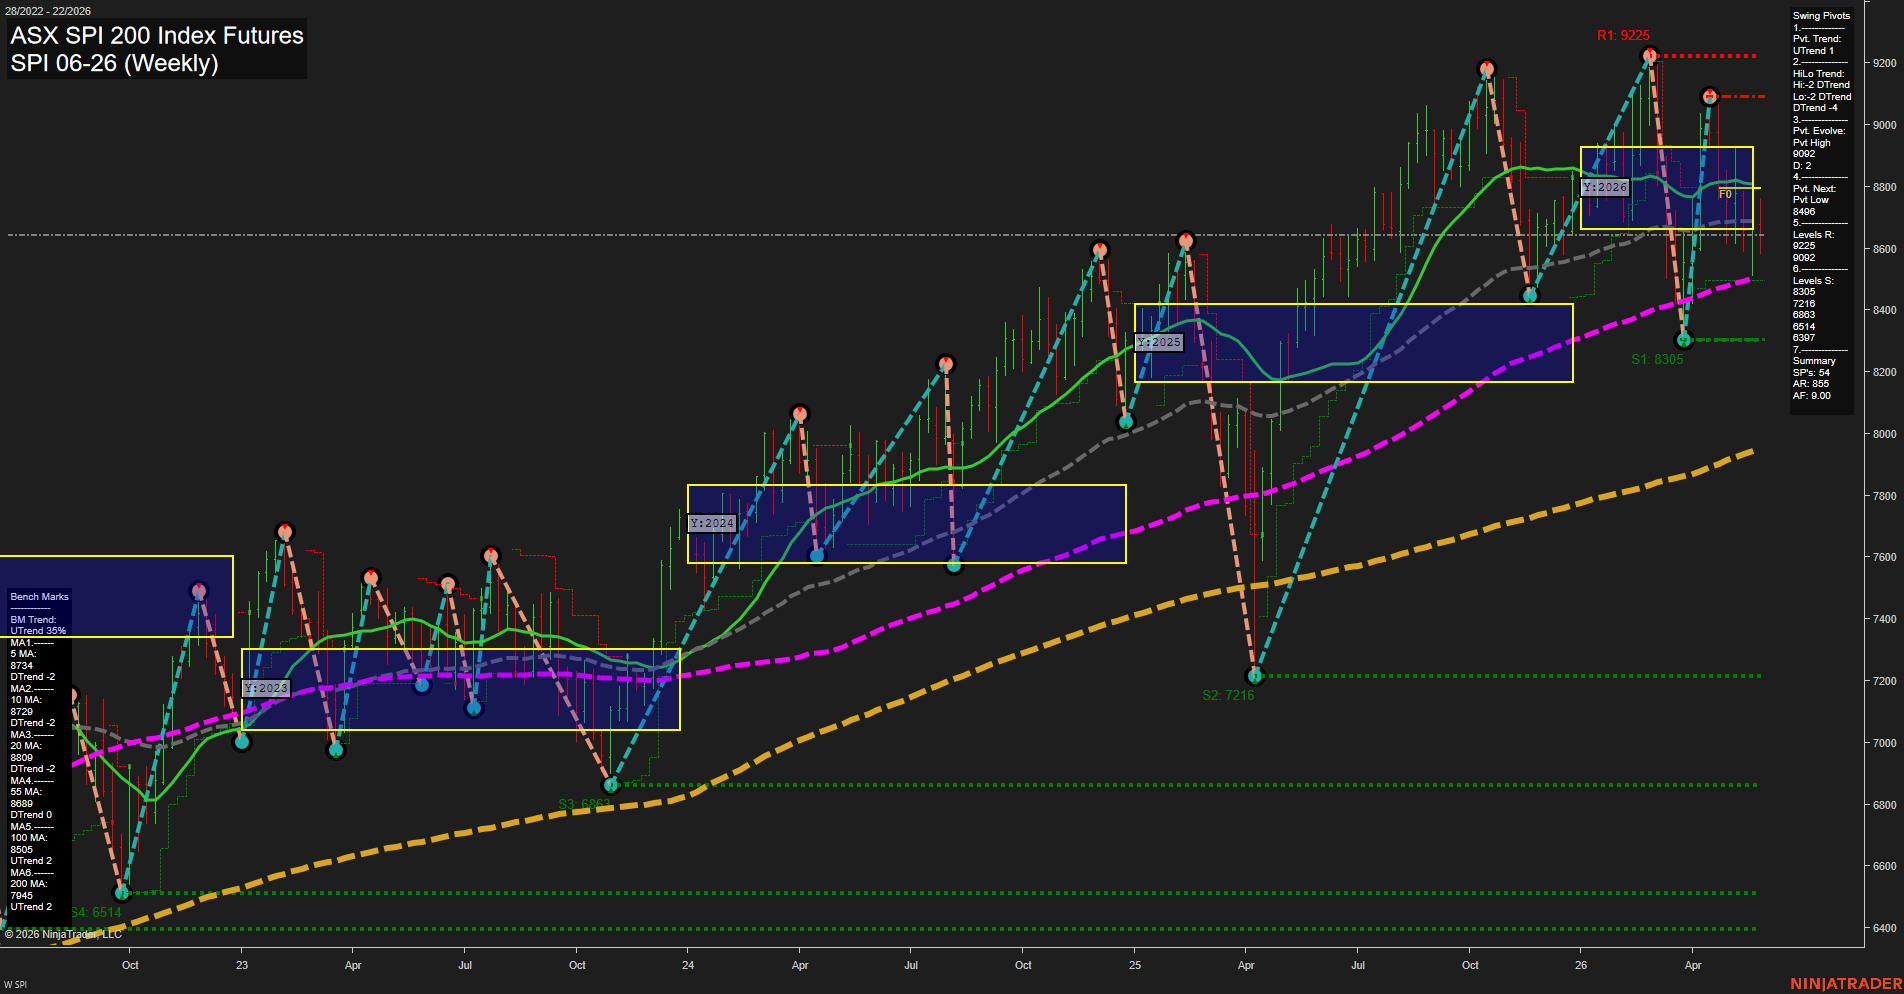
SPI ASX SPI 200 Index Futures Weekly Chart Analysis: 2026-May-28 07:07 CT
Price Action
- Last: 8615,
- Bars: Large,
- Mom: Average.
WSFG Weekly
- Short-Term
- WSFG Current: NA%
- F0%/NTZ' Bias: Price Neutral,
- WSFG Trend: Neutral.
MSFG Month May
- Intermediate-Term
- MSFG Current: NA%
- F0%/NTZ' Bias: Price Neutral,
- MSFG Trend: Neutral.
YSFG Year 2026
- Long-Term
- YSFG Current: NA%
- F0%/NTZ' Bias: Price Neutral,
- YSFG Trend: Neutral.
Swing Pivots
- (Short-Term) 1. Pvt. Trend: UTrend,
- (Intermediate-Term) 2. HiLo Trend: DTrend,
- 3. Pvt. Evolve: Pvt High 9092,
- 4. Pvt. Next: Pvt Low 8496,
- 5. Levels R: 9225, 9092,
- 6. Levels S: 8305, 7216, 6883, 6514, 6397.
Weekly Benchmarks
- (Short-Term) 5 Day: 8734 Down Trend,
- (Short-Term) 10 Day: 8729 Down Trend,
- (Intermediate-Term) 20 Day: 8809 Down Trend,
- (Intermediate-Term) 55 Day: 8689 Down Trend,
- (Long-Term) 100 Day: 8505 Up Trend,
- (Long-Term) 200 Day: 7945 Up Trend.
Overall Rating
- Short-Term: Bearish,
- Intermediate-Term: Bearish,
- Long-Term: Bullish.
Key Insights Summary
The weekly structure shows a strong multi-year uptrend that has recently shifted into a corrective phase from the 2026 high near 9225. Price is now trading back inside the 2026 session NTZ and below the clustered short- and intermediate-term benchmarks, which keeps the near-term tone soft and choppy rather than impulsive. The pivot map still shows a higher-timeframe bullish framework, but the current swing evolution has turned to a lower pivot sequence after the rejection from 9092, leaving 8496 as the next important downside pivot reference. Long-term structure remains constructive because price is still above the rising 100-day and 200-day benchmarks, while the recent pullback fits a retracement/consolidation phase after a strong rally and volatility expansion.
Chart Analysis ATS AI Generated: 2026-05-28 07:07 for Informational use only, not trading advice. Terms and Risk Disclosure Copyright © 2026. Algo Trading Systems LLC.