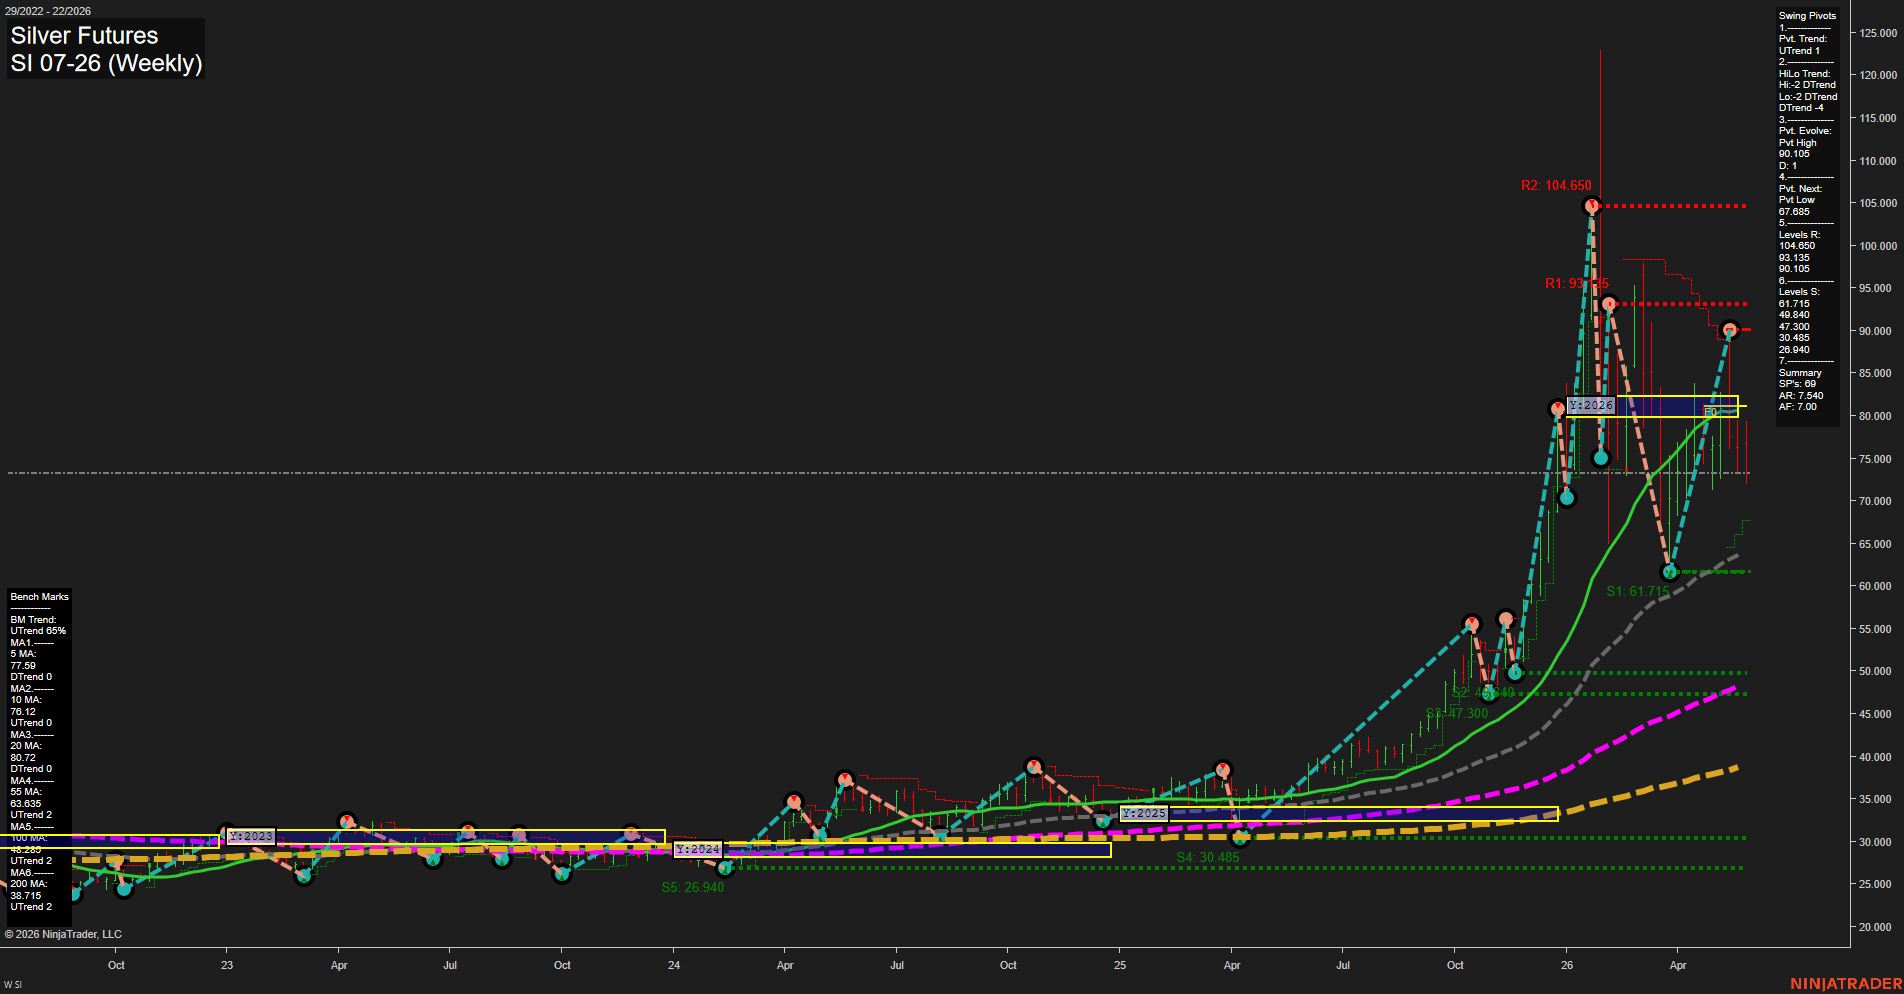
SI Silver Futures Weekly Chart Analysis: 2026-May-28 07:07 CT
Price Action
- Last: 74.00,
- Bars: Large,
- Mom: fast.
WSFG Weekly
- Short-Term
- WSFG Current: -38%
- F0%/NTZ' Bias: Price Below,
- WSFG Trend: Down.
MSFG Month May
- Intermediate-Term
- MSFG Current: -5%
- F0%/NTZ' Bias: Price Below,
- MSFG Trend: Down.
YSFG Year 2026
- Long-Term
- YSFG Current: -63%
- F0%/NTZ' Bias: Price Below,
- YSFG Trend: Down.
Swing Pivots
- (Short-Term) 1. Pvt. Trend: UTrend,
- (Intermediate-Term) 2. HiLo Trend: DTrend,
- 3. Pvt. Evolve: Pvt High 90.105,
- 4. Pvt. Next: Pvt Low 67.685,
- 5. Levels R: 104.650, 93.135, 90.105,
- 6. Levels S: 61.715, 49.840, 47.300, 30.485, 26.940.
Weekly Benchmarks
- (Short-Term) 5 Day: 77.59 Down Trend,
- (Short-Term) 10 Day: 78.12 Up Trend,
- (Intermediate-Term) 20 Day: 80.72 Down Trend,
- (Intermediate-Term) 55 Day: 63.65 Up Trend,
- (Long-Term) 100 Day: 48.59 Up Trend,
- (Long-Term) 200 Day: 38.715 Up Trend.
Recent Trade Signals
- 27 May 2026: Short SI 07-26 @ 75.475 Signals.USAR-WSFG
- 27 May 2026: Short SI 07-26 @ 75.98 Signals.USAR.TR120
- 25 May 2026: Long SI 07-26 @ 78.1 Signals.USAR-MSFG
Overall Rating
- Short-Term: Bearish,
- Intermediate-Term: Bearish,
- Long-Term: Neutral.
Key Insights Summary
Silver futures are in a strong cyclical decline from the 2026 spike to the 104.650 pivot high, with price now trading well below the yearly, monthly, and weekly F0%/NTZ reference zones. The weekly structure still shows a UTrend pivot sequence on the most recent swing map, but the broader hi/lo framework has rolled over into a lower-trend regime after the failed extension above 90.105. The market is now digesting the sharp post-peak reversal with large weekly ranges and fast momentum, a sign of elevated volatility and active re-pricing. Benchmarks remain mixed across the stack, but the short-term tape is clearly weaker than the longer-dated averages, while the recent short trade signals align with the current downside rhythm. Overall, the chart reflects a bearish corrective-to-downtrend environment after a parabolic advance, with the current phase behaving like a broad retracement and trend reset rather than a stable base.
Chart Analysis ATS AI Generated: 2026-05-28 07:07 for Informational use only, not trading advice. Terms and Risk Disclosure Copyright © 2026. Algo Trading Systems LLC.