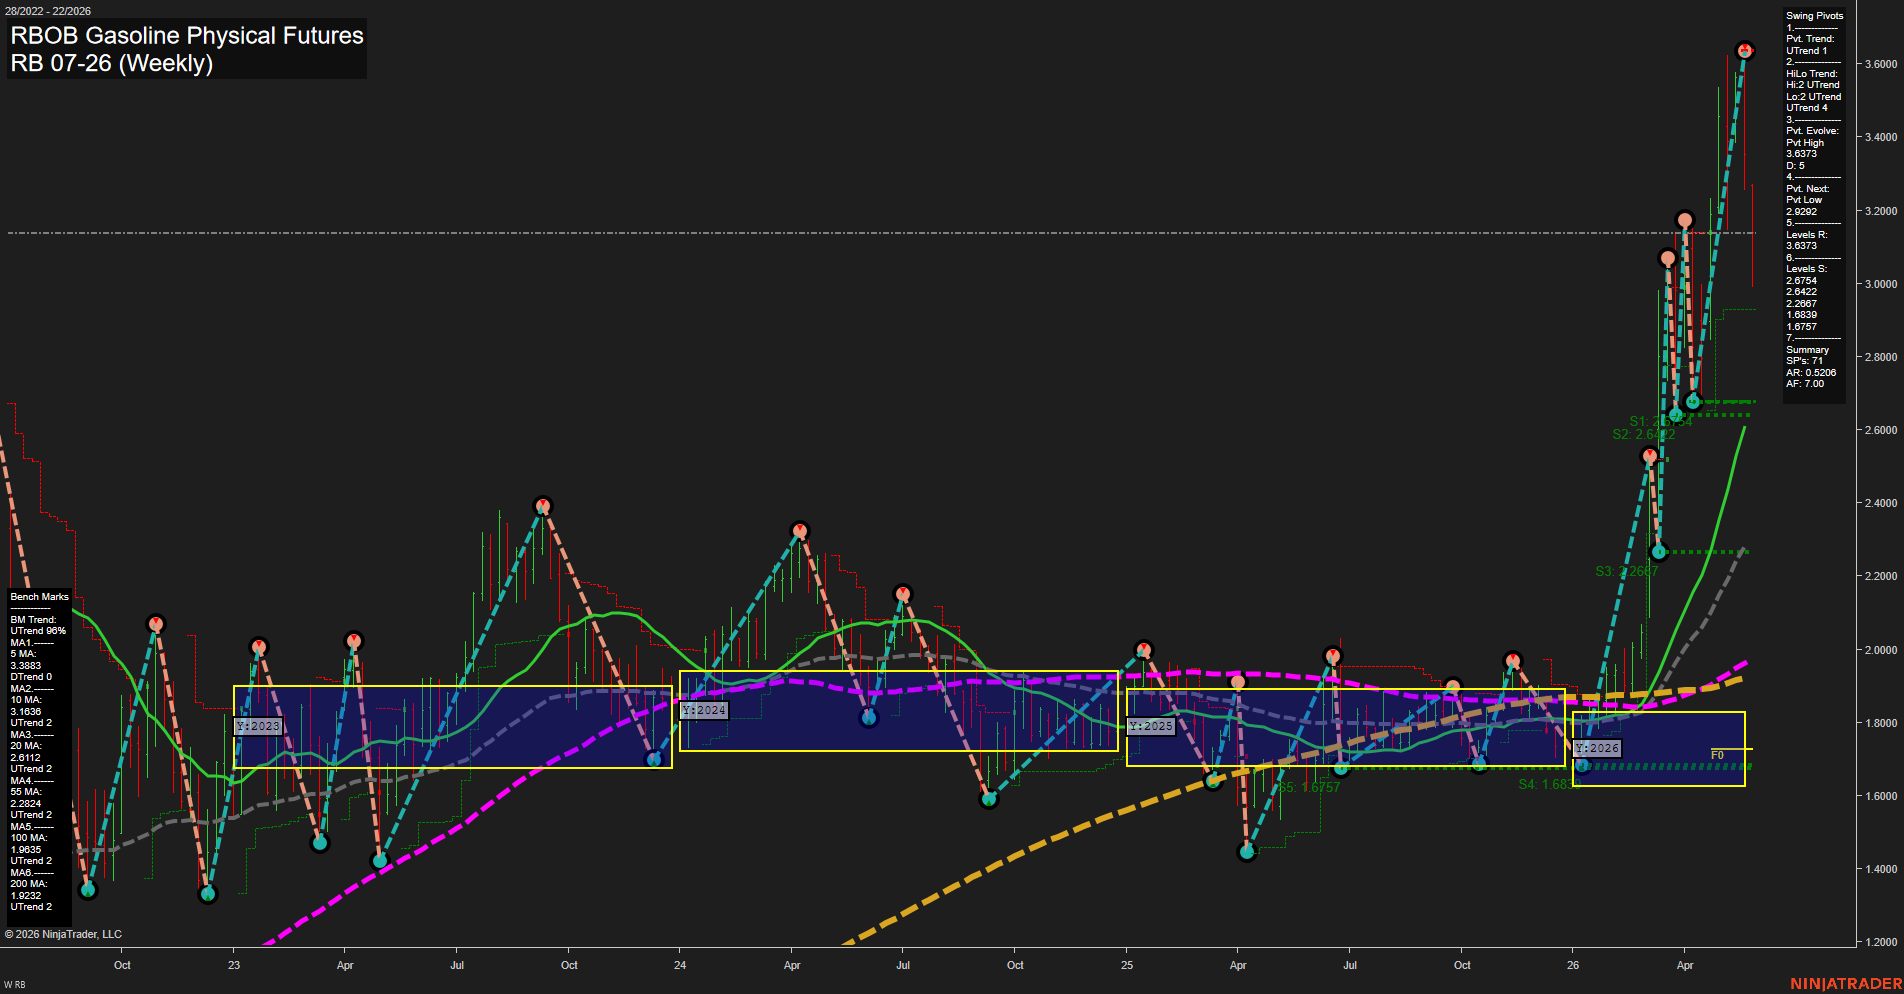
RB RBOB Gasoline Physical Futures Weekly Chart Analysis: 2026-May-28 07:06 CT
Price Action
- Last: 3.6373,
- Bars: Large,
- Mom: fast.
WSFG Weekly
- Short-Term
- WSFG Current: -40%
- F0%/NTZ' Bias: Price Below,
- WSFG Trend: Down.
MSFG Month May
- Intermediate-Term
- MSFG Current: -66%
- F0%/NTZ' Bias: Price Below,
- MSFG Trend: Down.
YSFG Year 2026
- Long-Term
- YSFG Current: 140%
- F0%/NTZ' Bias: Price Above,
- YSFG Trend: Up.
Swing Pivots
- (Short-Term) 1. Pvt. Trend: UTrend,
- (Intermediate-Term) 2. HiLo Trend: UTrend,
- 3. Pvt. Evolve: Pvt High 3.6373,
- 4. Pvt. Next: Pvt Low 2.9292,
- 5. Levels R: 3.6373,
- 6. Levels S: 2.6754, 2.6422, 2.2687, 1.6839, 1.6757.
Weekly Benchmarks
- (Short-Term) 5 Day: 3.3883 Down Trend,
- (Short-Term) 10 Day: 3.1636 Up Trend,
- (Intermediate-Term) 20 Day: 2.6112 Up Trend,
- (Intermediate-Term) 55 Day: 2.2824 Up Trend,
- (Long-Term) 100 Day: 1.9835 Up Trend,
- (Long-Term) 200 Day: 1.9232 Up Trend.
Recent Trade Signals
- 26 May 2026: Short RB 07-26 @ 3.2057 Signals.USAR-WSFG
- 21 May 2026: Short RB 07-26 @ 3.388 Signals.USAR-MSFG
- 20 May 2026: Short RB 07-26 @ 3.4274 Signals.USAR.TR120
Overall Rating
- Short-Term: Bullish,
- Intermediate-Term: Bullish,
- Long-Term: Bullish.
Key Insights Summary
Weekly structure shows an aggressive upside expansion from the 2026 base, with price pushing decisively above the Yearly Session Fib Grid and printing a new swing high at 3.6373. The short-term WSFG and monthly MSFG remain below their F0% centers and still read down, but price has overrun that weakness with strong momentum and large-range candles. Swing pivot structure has flipped to UTrend across both short-term and HiLo trend measures, while the next pivot objective is now a lower retracement point at 2.9292. Benchmarks are broadly supportive, with price well above the 20, 55, 100, and 200 day averages, and the 5 day average still below price despite its down trend. The recent sequence of short signals captures the prior pullback phase, but the current tape is a vertical trend continuation, breakout, and extension profile with strong bullish long-term alignment.
Chart Analysis ATS AI Generated: 2026-05-28 07:06 for Informational use only, not trading advice. Terms and Risk Disclosure Copyright © 2026. Algo Trading Systems LLC.