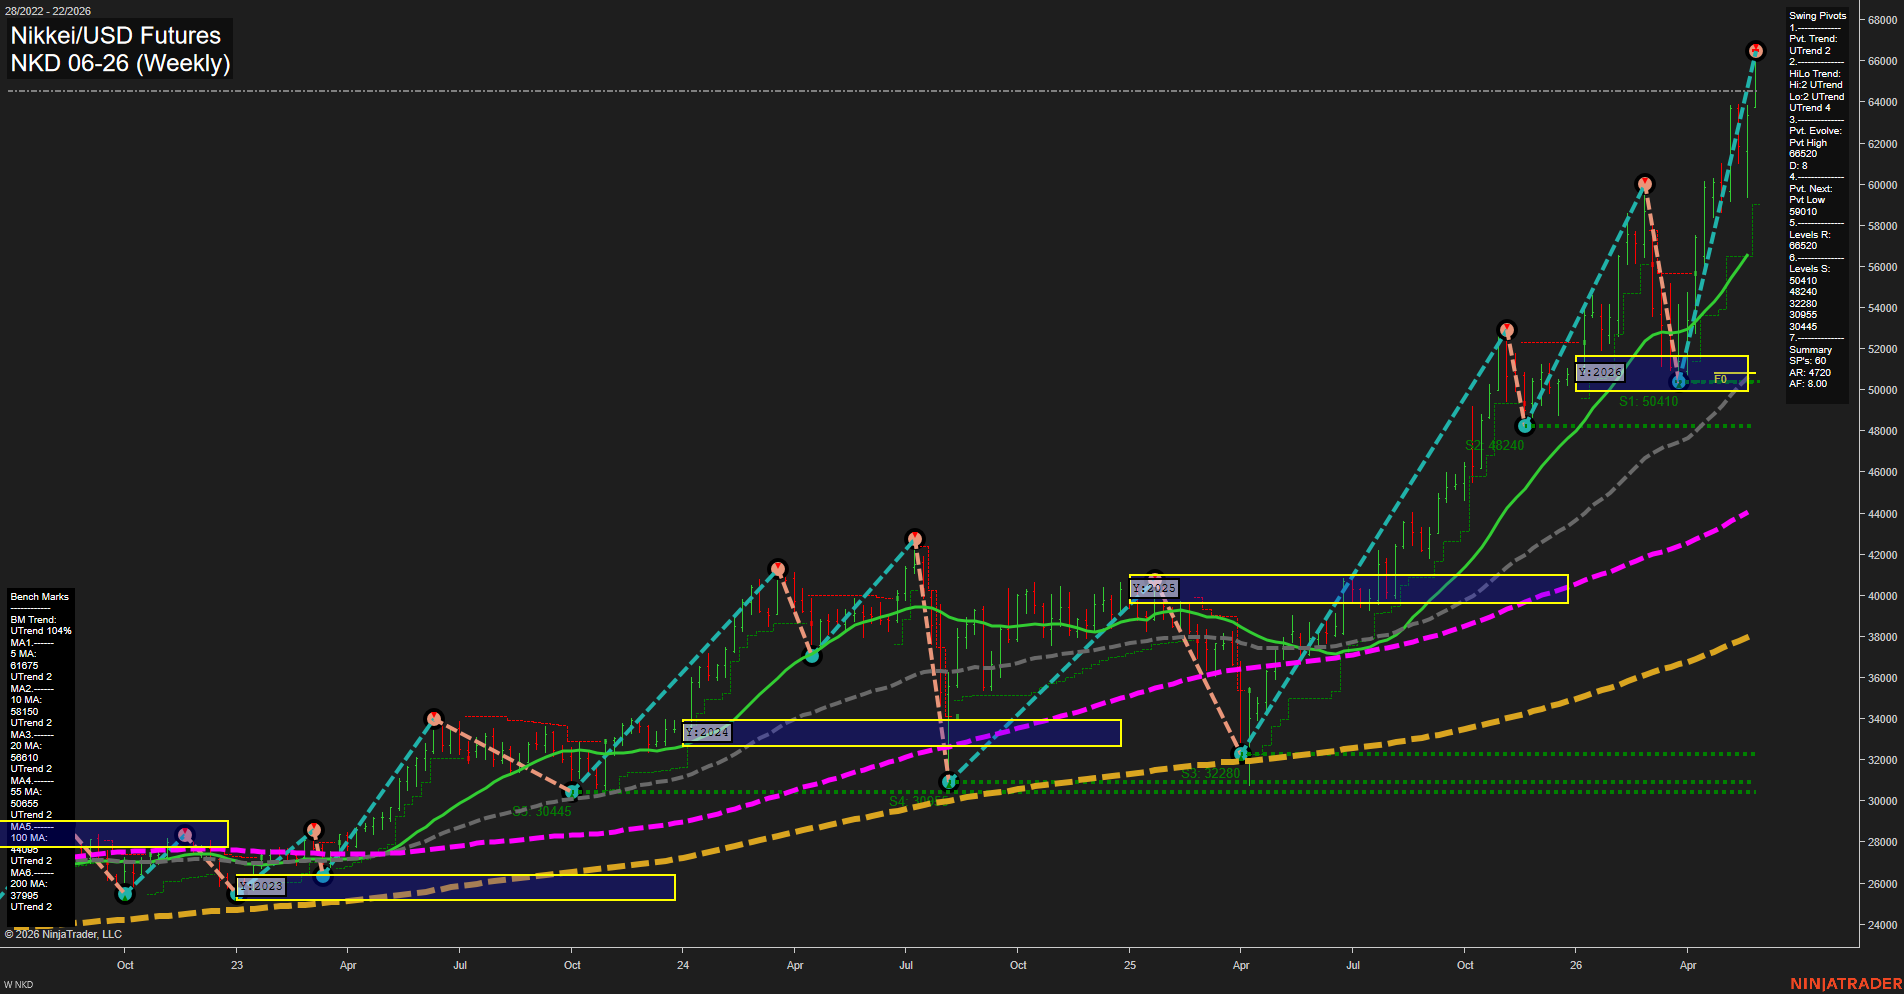
NKD Nikkei/USD Futures Weekly Chart Analysis: 2026-May-28 07:05 CT
Price Action
- Last: 65300,
- Bars: Large,
- Mom: fast.
WSFG Weekly
- Short-Term
- WSFG Current: 24%
- F0%/NTZ' Bias: Price Above,
- WSFG Trend: Up.
MSFG Month May
- Intermediate-Term
- MSFG Current: 74%
- F0%/NTZ' Bias: Price Above,
- MSFG Trend: Up.
YSFG Year 2026
- Long-Term
- YSFG Current: 162%
- F0%/NTZ' Bias: Price Above,
- YSFG Trend: Up.
Swing Pivots
- (Short-Term) 1. Pvt. Trend: UTrend,
- (Intermediate-Term) 2. HiLo Trend: UTrend,
- 3. Pvt. Evolve: Pvt High 66520,
- 4. Pvt. Next: Pvt Low 59010,
- 5. Levels R: 66520,
- 6. Levels S: 50410, 48240, 32280, 30955, 30445.
Weekly Benchmarks
- (Short-Term) 5 Day: 61675 Up Trend,
- (Short-Term) 10 Day: 58150 Up Trend,
- (Intermediate-Term) 20 Day: 56810 Up Trend,
- (Intermediate-Term) 55 Day: 50655 Up Trend,
- (Long-Term) 100 Day: 44080 Up Trend,
- (Long-Term) 200 Day: 37965 Up Trend.
Recent Trade Signals
- 21 May 2026: Long NKD 06-26 @ 62255 Signals.USAR-WSFG
- 20 May 2026: Long NKD 06-26 @ 61350 Signals.USAR.TR120
- 20 May 2026: Long NKD 06-26 @ 61200 Signals.USAR-MSFG
Overall Rating
- Short-Term: Bullish,
- Intermediate-Term: Bullish,
- Long-Term: Bullish.
Key Insights Summary
NKD remains in a strong bullish weekly structure with price pushing into fresh highs after a sharp continuation leg from the 2025 base. The current candle sequence shows strong momentum and expanding range, consistent with trend acceleration rather than a mature top. All benchmark moving averages are stacked in bullish alignment, with price well above the 20, 55, 100, and 200-day references, confirming durable upside trend structure. Swing pivot trend is still UTrend on both the short and intermediate read, while the next major pivot reference sits back at 59010 and overhead resistance is cleared at 66520, leaving the chart in price discovery mode above the yearly session grid.
Chart Analysis ATS AI Generated: 2026-05-28 07:05 for Informational use only, not trading advice. Terms and Risk Disclosure Copyright © 2026. Algo Trading Systems LLC.