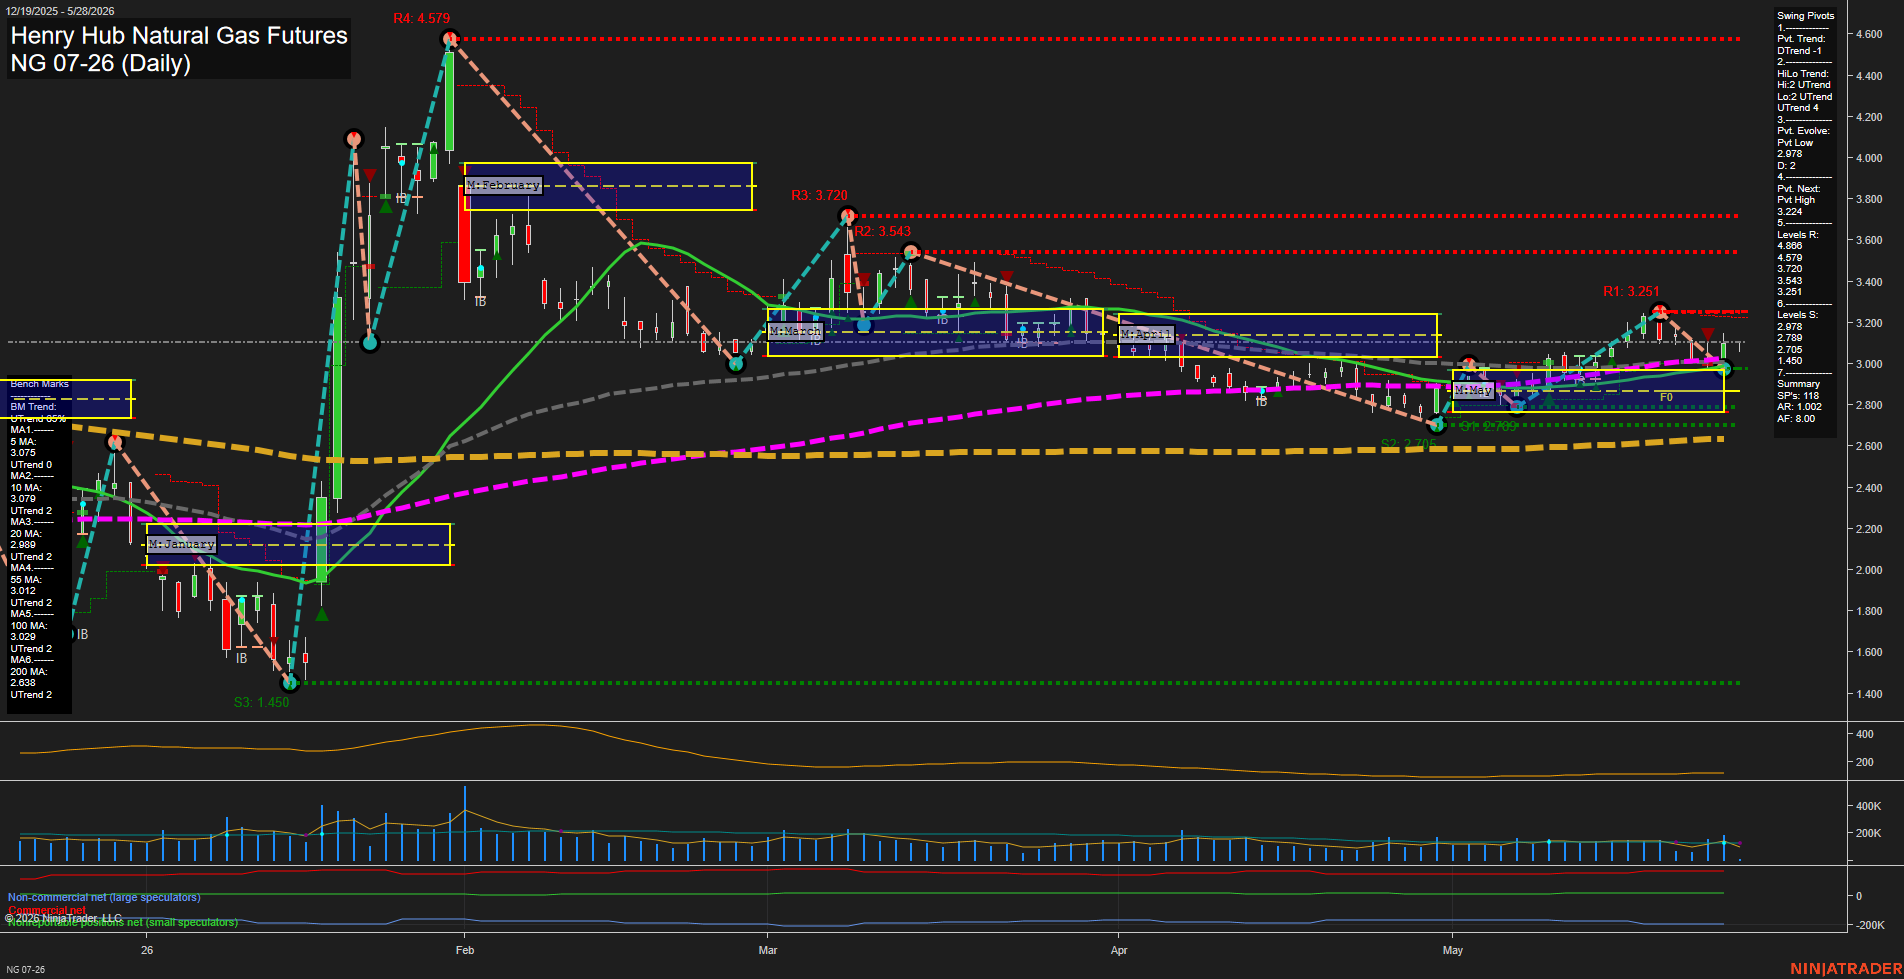
NG Henry Hub Natural Gas Futures Daily Chart Analysis: 2026-May-28 07:04 CT
Price Action
- Last: 2.978,
- Bars: Medium,
- Mom: average.
WSFG Weekly
- Short-Term
- WSFG Current: 40%
- F0%/NTZ' Bias: Price Above,
- WSFG Trend: Up.
MSFG Month May
- Intermediate-Term
- MSFG Current: 30%
- F0%/NTZ' Bias: Price Above,
- MSFG Trend: Up.
YSFG Year 2026
- Long-Term
- YSFG Current: 26%
- F0%/NTZ' Bias: Price Above,
- YSFG Trend: Up.
Swing Pivots
- (Short-Term) 1. Pvt. Trend: DTrend,
- (Intermediate-Term) 2. HiLo Trend: UTrend,
- 3. Pvt. Evolve: Pvt Low 2.978,
- 4. Pvt. Next: Pvt High 3.224,
- 5. Levels R: 4.886, 4.579, 3.720, 3.543, 3.251,
- 6. Levels S: 2.978, 2.789, 2.705, 1.450.
Daily Benchmarks
- (Short-Term) 5 Day: 3.075 Down Trend,
- (Short-Term) 10 Day: 3.079 Down Trend,
- (Intermediate-Term) 20 Day: 2.989 Down Trend,
- (Intermediate-Term) 55 Day: 3.012 Down Trend,
- (Long-Term) 100 Day: 3.029 Down Trend,
- (Long-Term) 200 Day: 2.638 Up Trend.
Additional Metrics
Overall Rating
- Short-Term: Bearish,
- Intermediate-Term: Neutral,
- Long-Term: Neutral.
Key Insights Summary
Natural gas is trading in a broad, multi-month consolidation after the sharp winter breakout and subsequent retracement from the 4.579 spike high. Price is sitting near the lower end of the recent May range and just above a key pivot support cluster around 2.978 to 2.705, while the benchmark stack remains mixed to soft with price below the 5, 10, 20, 55, and 100-day averages but still above the 200-day. The swing pivot structure shows a short-term downtrend, yet the higher-timeframe high/low trend remains upward, which keeps the larger pattern constructive even as the daily tape stays choppy and range-bound. The Monthly and Weekly Session Fib grids remain biased above F0%, matching a broader up-tilted seasonal structure, but the current daily location reflects a pullback phase rather than an impulsive trend leg. Resistance is layered at 3.251, 3.543, and 3.720, while support is concentrated at 2.978, 2.789, 2.705, and the deeper 1.450 base, framing the market as a rotation zone between retracement and recovery.
Chart Analysis ATS AI Generated: 2026-05-28 07:05 for Informational use only, not trading advice. Terms and Risk Disclosure Copyright © 2026. Algo Trading Systems LLC.