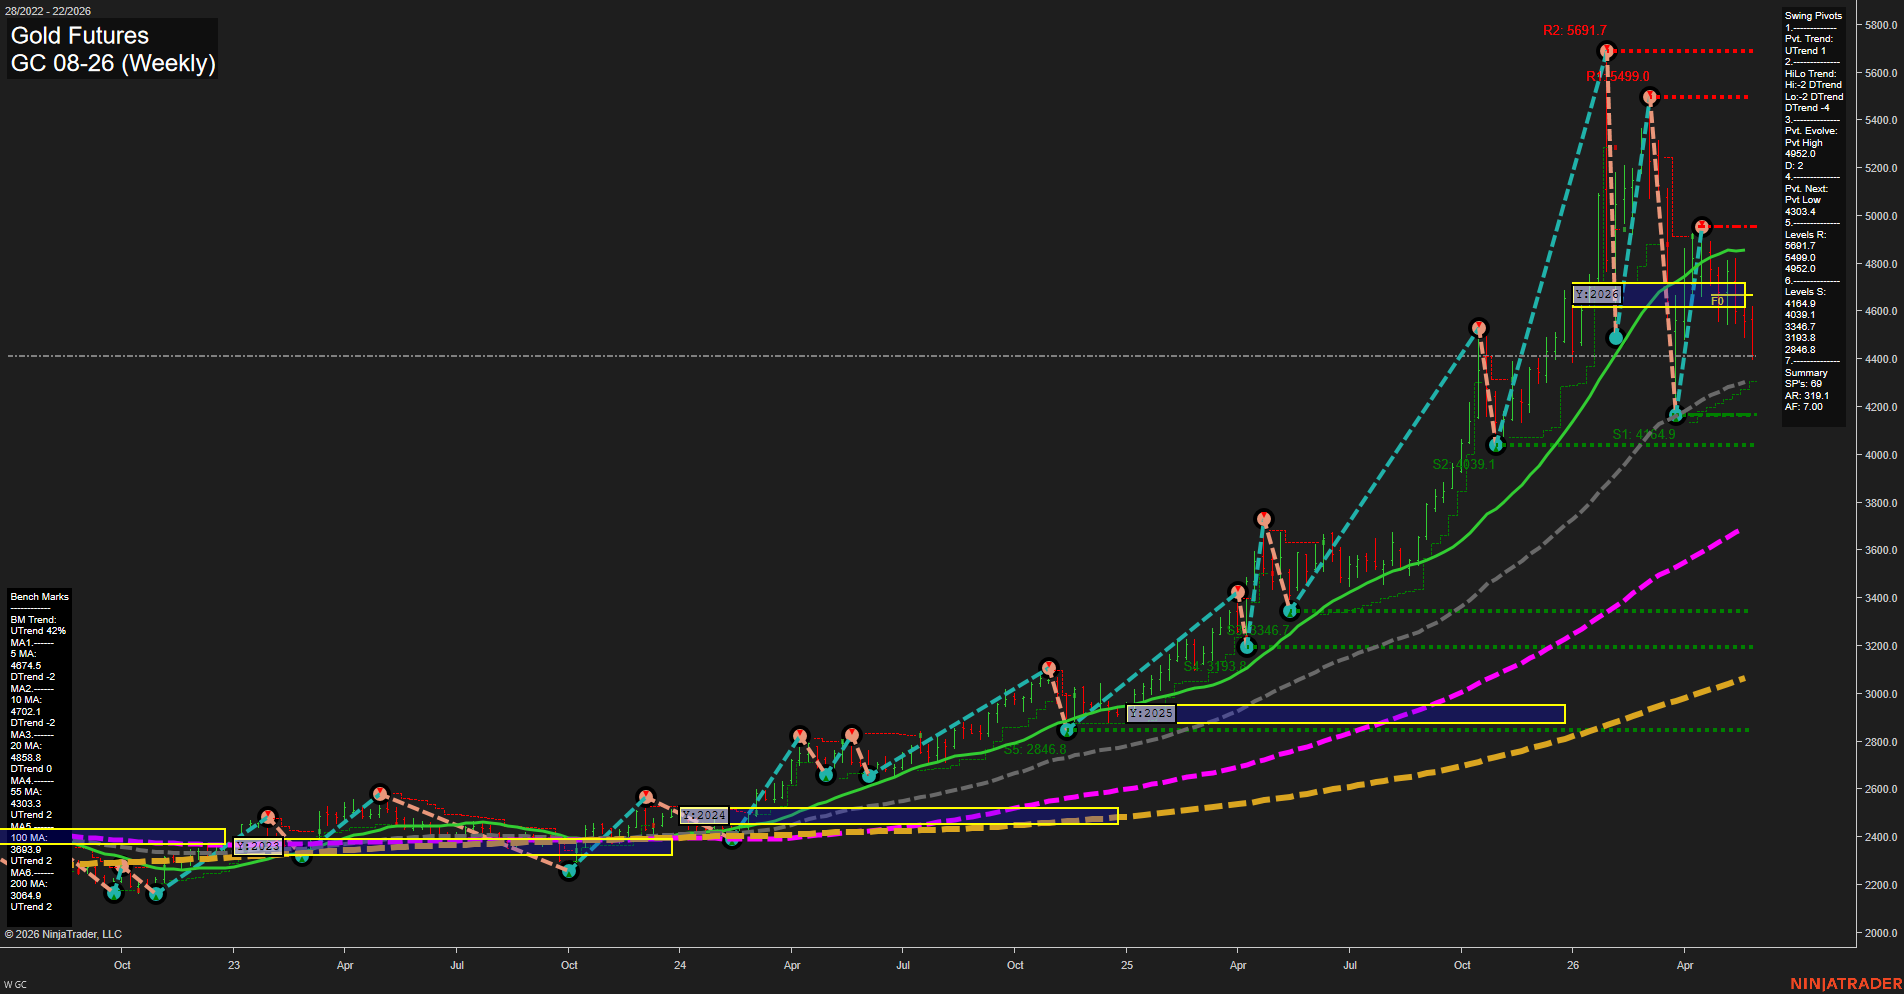
GC Gold Futures Weekly Chart Analysis: 2026-May-28 07:04 CT
Price Action
- Last: 4630.0,
- Bars: Large,
- Mom: Fast.
WSFG Weekly
- Short-Term
- WSFG Current: -71%
- F0%/NTZ' Bias: Price Below,
- WSFG Trend: Down.
MSFG Month May
- Intermediate-Term
- MSFG Current: -29%
- F0%/NTZ' Bias: Price Below,
- MSFG Trend: Down.
YSFG Year 2026
- Long-Term
- YSFG Current: -49%
- F0%/NTZ' Bias: Price Below,
- YSFG Trend: Down.
Swing Pivots
- (Short-Term) 1. Pvt. Trend: UTrend,
- (Intermediate-Term) 2. HiLo Trend: DTrend,
- 3. Pvt. Evolve: Pvt High 4952.0,
- 4. Pvt. Next: Pvt Low 4303.4,
- 5. Levels R: 5691.7, 5499.0, 4952.0,
- 6. Levels S: 4164.9, 4039.1, 3346.8, 3193.8, 2846.8.
Weekly Benchmarks
- (Short-Term) 5 Day: 4674.5 Down Trend,
- (Short-Term) 10 Day: 4702.1 Down Trend,
- (Intermediate-Term) 20 Day: 4858.8 Down Trend,
- (Intermediate-Term) 55 Day: 4303.3 Up Trend,
- (Long-Term) 100 Day: 3893.9 Up Trend,
- (Long-Term) 200 Day: 3064.9 Up Trend.
Recent Trade Signals
- 27 May 2026: Short GC 06-26 @ 4480.1 Signals.USAR-MSFG
- 27 May 2026: Short GC 06-26 @ 4496.4 Signals.USAR-WSFG
- 26 May 2026: Short GC 06-26 @ 4515.1 Signals.USAR.TR120
Overall Rating
- Short-Term: Bearish,
- Intermediate-Term: Bearish,
- Long-Term: Bullish.
Key Insights Summary
Gold futures are still operating within a powerful longer-term advance, but the weekly structure has shifted into a corrective phase after the sharp run to the 2026 highs. Price is sitting below the yearly, monthly, and weekly session fib centers, keeping the short and intermediate backdrop aligned to the downside. The pivot structure shows a short-term uptrend against an intermediate downtrend, which fits a volatile retracement environment rather than a clean trend continuation. Weekly benchmarks are mixed: the faster averages are rolling over while the 55, 100, and 200 day benchmarks remain higher and rising, preserving the larger bullish trend. Recent short signals across WSFG, MSFG, and TR120 reinforce the current pressure. Overall, the chart looks like a broad uptrend digesting a major impulse with lower highs, sharp rejection swings, and active mean reversion around the 4600-4900 zone.
Chart Analysis ATS AI Generated: 2026-05-28 07:04 for Informational use only, not trading advice. Terms and Risk Disclosure Copyright © 2026. Algo Trading Systems LLC.