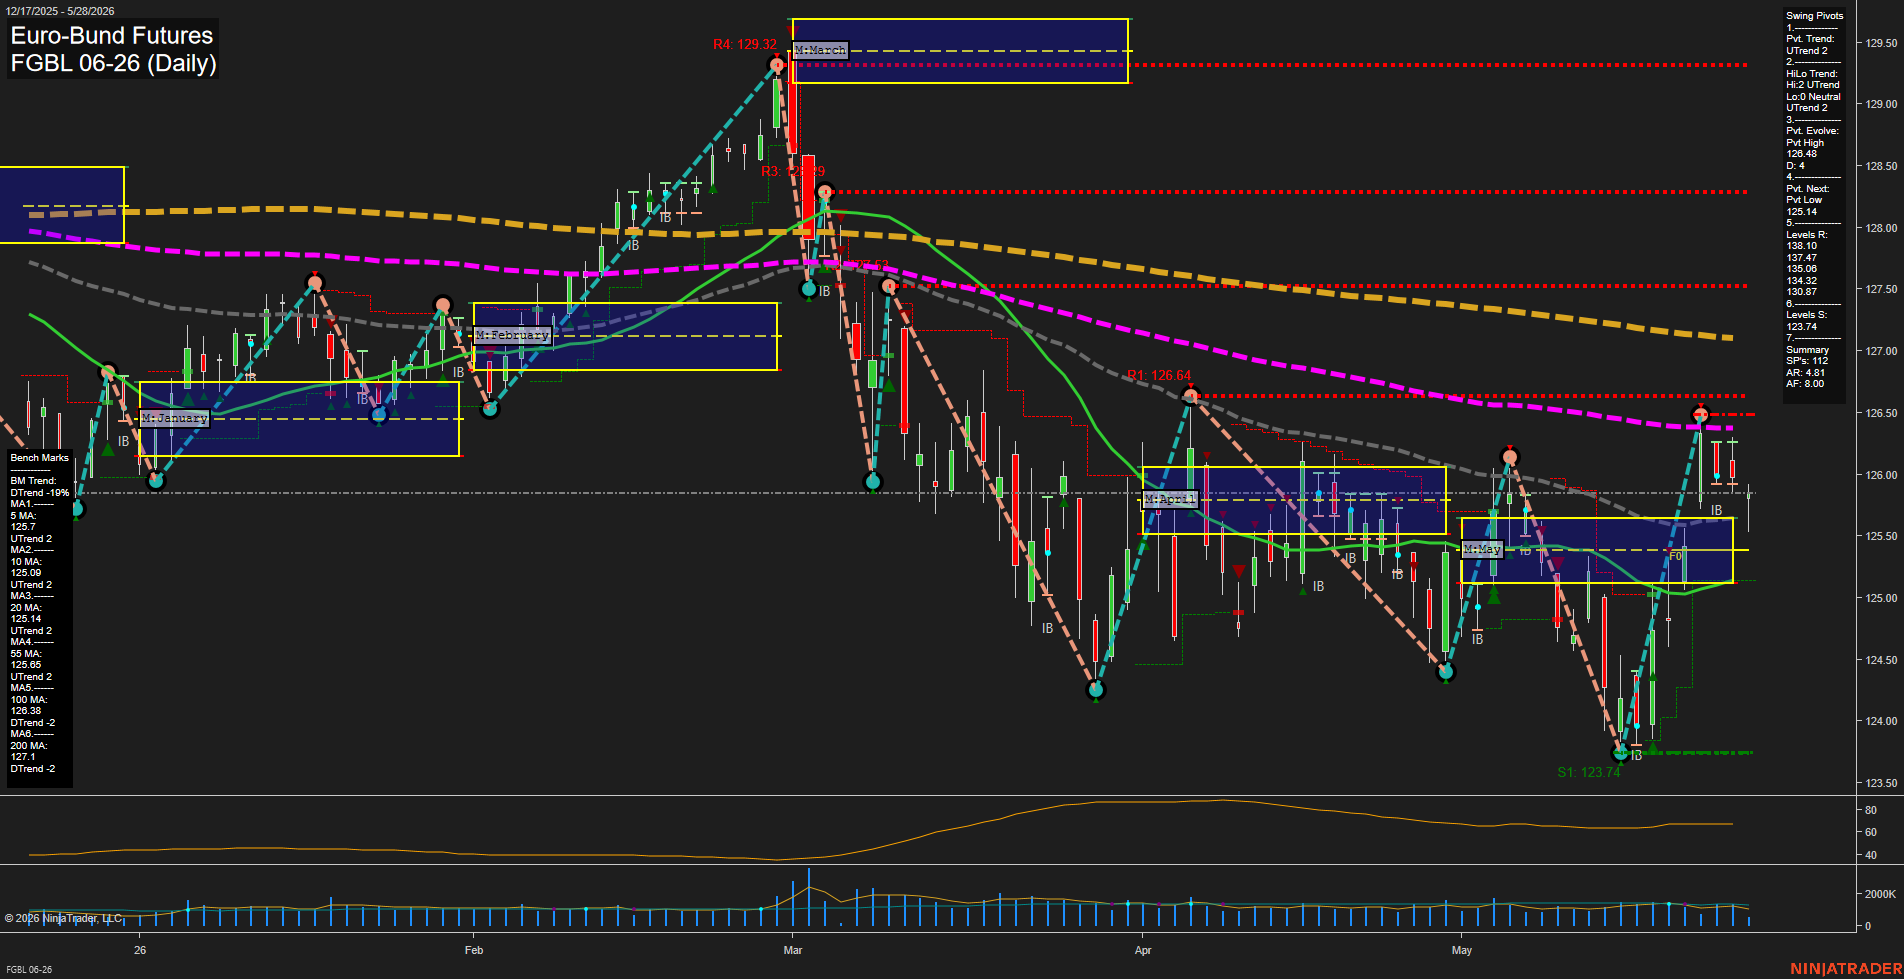
FGBL Euro-Bund Futures Daily Chart Analysis: 2026-May-28 07:03 CT
Price Action
- Last: 125.74,
- Bars: Medium,
- Mom: Average.
WSFG Weekly
- Short-Term
- WSFG Current: 1%
- F0%/NTZ' Bias: Price Above,
- WSFG Trend: Up.
MSFG Month May
- Intermediate-Term
- MSFG Current: 15%
- F0%/NTZ' Bias: Price Above,
- MSFG Trend: Up.
YSFG Year 2026
- Long-Term
- YSFG Current: -6%
- F0%/NTZ' Bias: Price Below,
- YSFG Trend: Down.
Swing Pivots
- (Short-Term) 1. Pvt. Trend: UTrend,
- (Intermediate-Term) 2. HiLo Trend: UTrend,
- 3. Pvt. Evolve: Pvt High 126.48,
- 4. Pvt. Next: Pvt Low 125.14,
- 5. Levels R: 138.10, 137.47, 135.06, 134.32, 130.87,
- 6. Levels S: 123.74.
Daily Benchmarks
- (Short-Term) 5 Day: 125.70 Up Trend,
- (Short-Term) 10 Day: 125.09 Up Trend,
- (Intermediate-Term) 20 Day: 125.14 Up Trend,
- (Intermediate-Term) 55 Day: 125.65 Up Trend,
- (Long-Term) 100 Day: 126.38 Down Trend,
- (Long-Term) 200 Day: 127.10 Down Trend.
Additional Metrics
Recent Trade Signals
- 28 May 2026: Short FGBL 06-26 @ 125.56 Signals.USAR.TR120
- 28 May 2026: Short FGBL 06-26 @ 125.56 Signals.USAR-WSFG
- 26 May 2026: Long FGBL 06-26 @ 126 Signals.USAR-MSFG
- 22 May 2026: Long FGBL 06-26 @ 125.42 Signals.USAR.TR720
Overall Rating
- Short-Term: Bullish,
- Intermediate-Term: Bullish,
- Long-Term: Bearish.
Key Insights Summary
Euro-Bund futures are holding a mixed but constructive short-term structure after a sharp March selloff and a choppy April-to-May recovery phase. Price is above both the weekly and monthly session fib midlines, and the short-term pivot structure remains in uptrend mode, which keeps the near-term tone firm despite the latest pullback from the recent 126.48 pivot high. The daily benchmark stack is supportive on the short and intermediate horizons, with the 5, 10, 20, and 55 day averages all aligned in uptrend, while the 100 and 200 day averages remain in downtrend and keep the broader yearly backdrop negative. The swing profile shows a lower long-term yearly fib bias and a sequence of failed push/reject patterns near prior highs, but current price action is still trading within the upper half of the recent range. From a futures swing trader perspective, the chart is in a transition phase: short-term trend strength is present, intermediate structure is improving, and long-term trend pressure is still down.
Chart Analysis ATS AI Generated: 2026-05-28 07:04 for Informational use only, not trading advice. Terms and Risk Disclosure Copyright © 2026. Algo Trading Systems LLC.