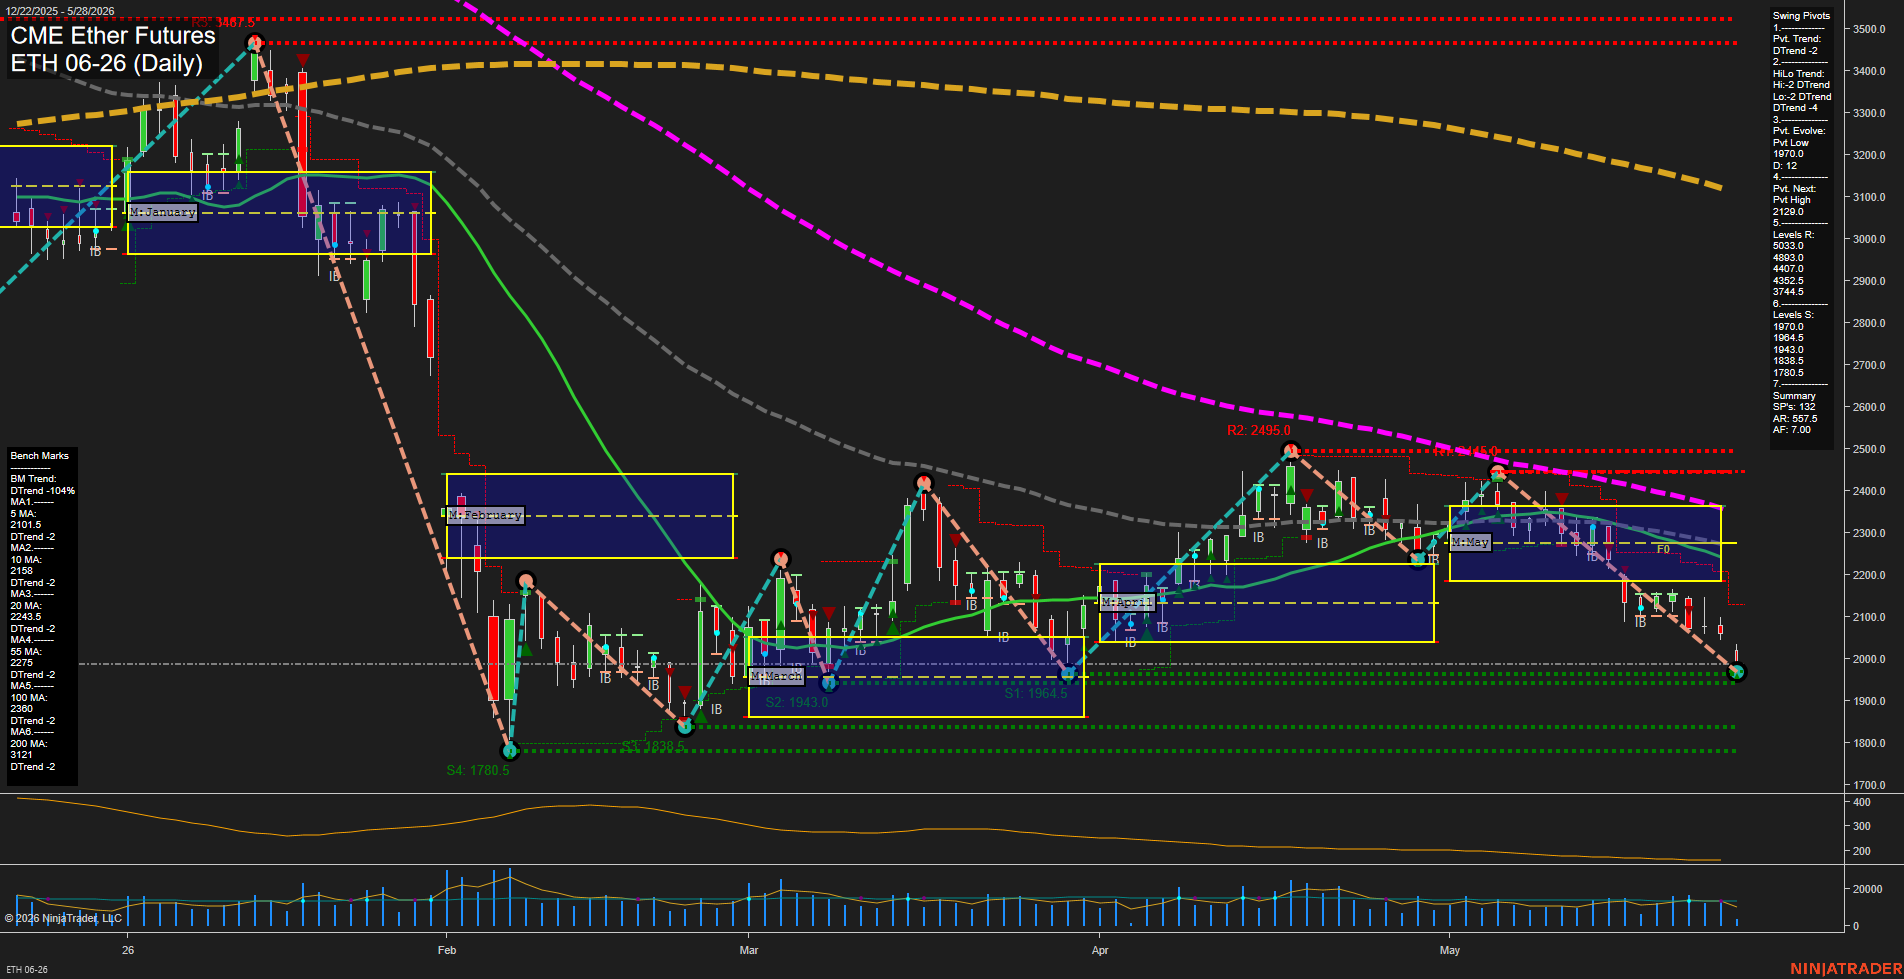
ETH CME Ether Futures Daily Chart Analysis: 2026-May-28 07:03 CT
Price Action
- Last: 1964.5,
- Bars: Large,
- Mom: fast.
WSFG Weekly
- Short-Term
- WSFG Current: -56%
- F0%/NTZ' Bias: Price Below,
- WSFG Trend: Down.
MSFG Month May
- Intermediate-Term
- MSFG Current: -63%
- F0%/NTZ' Bias: Price Below,
- MSFG Trend: Down.
YSFG Year 2026
- Long-Term
- YSFG Current: -40%
- F0%/NTZ' Bias: Price Below,
- YSFG Trend: Down.
Swing Pivots
- (Short-Term) 1. Pvt. Trend: DTrend,
- (Intermediate-Term) 2. HiLo Trend: DTrend,
- 3. Pvt. Evolve: Pvt low 1970.0,
- 4. Pvt. Next: Pvt high 2129.0,
- 5. Levels R: 5033.0, 4893.0, 4407.0, 4352.5, 3744.5,
- 6. Levels S: 1970.0, 1964.5, 1943.0, 1838.5, 1780.5.
Daily Benchmarks
- (Short-Term) 5 Day: 2101.5 Down Trend,
- (Short-Term) 10 Day: 2158 Down Trend,
- (Intermediate-Term) 20 Day: 2243.5 Down Trend,
- (Intermediate-Term) 55 Day: 2275 Down Trend,
- (Long-Term) 100 Day: 2360 Down Trend,
- (Long-Term) 200 Day: 3121 Down Trend.
Additional Metrics
Overall Rating
- Short-Term: Bearish,
- Intermediate-Term: Bearish,
- Long-Term: Bearish.
Key Insights Summary
ETH CME Ether Futures is in a decisive daily downtrend with price trading well below all benchmark moving averages and below the monthly, weekly, and yearly session fib center lines. The swing structure remains bearish, with lower highs and lower lows defining the current sequence, and the latest push has extended momentum into the lower end of the active support band near the 1964.5 to 1943.0 area. The larger chart shows a prior distribution zone in May failing to hold, followed by a sharp rollover that confirms continuation pressure rather than consolidation. With the 20/55/100/200-day averages all sloping down and positioned overhead, the broader trend stack remains firmly negative across short-, intermediate-, and long-term horizons.
Chart Analysis ATS AI Generated: 2026-05-28 07:03 for Informational use only, not trading advice. Terms and Risk Disclosure Copyright © 2026. Algo Trading Systems LLC.