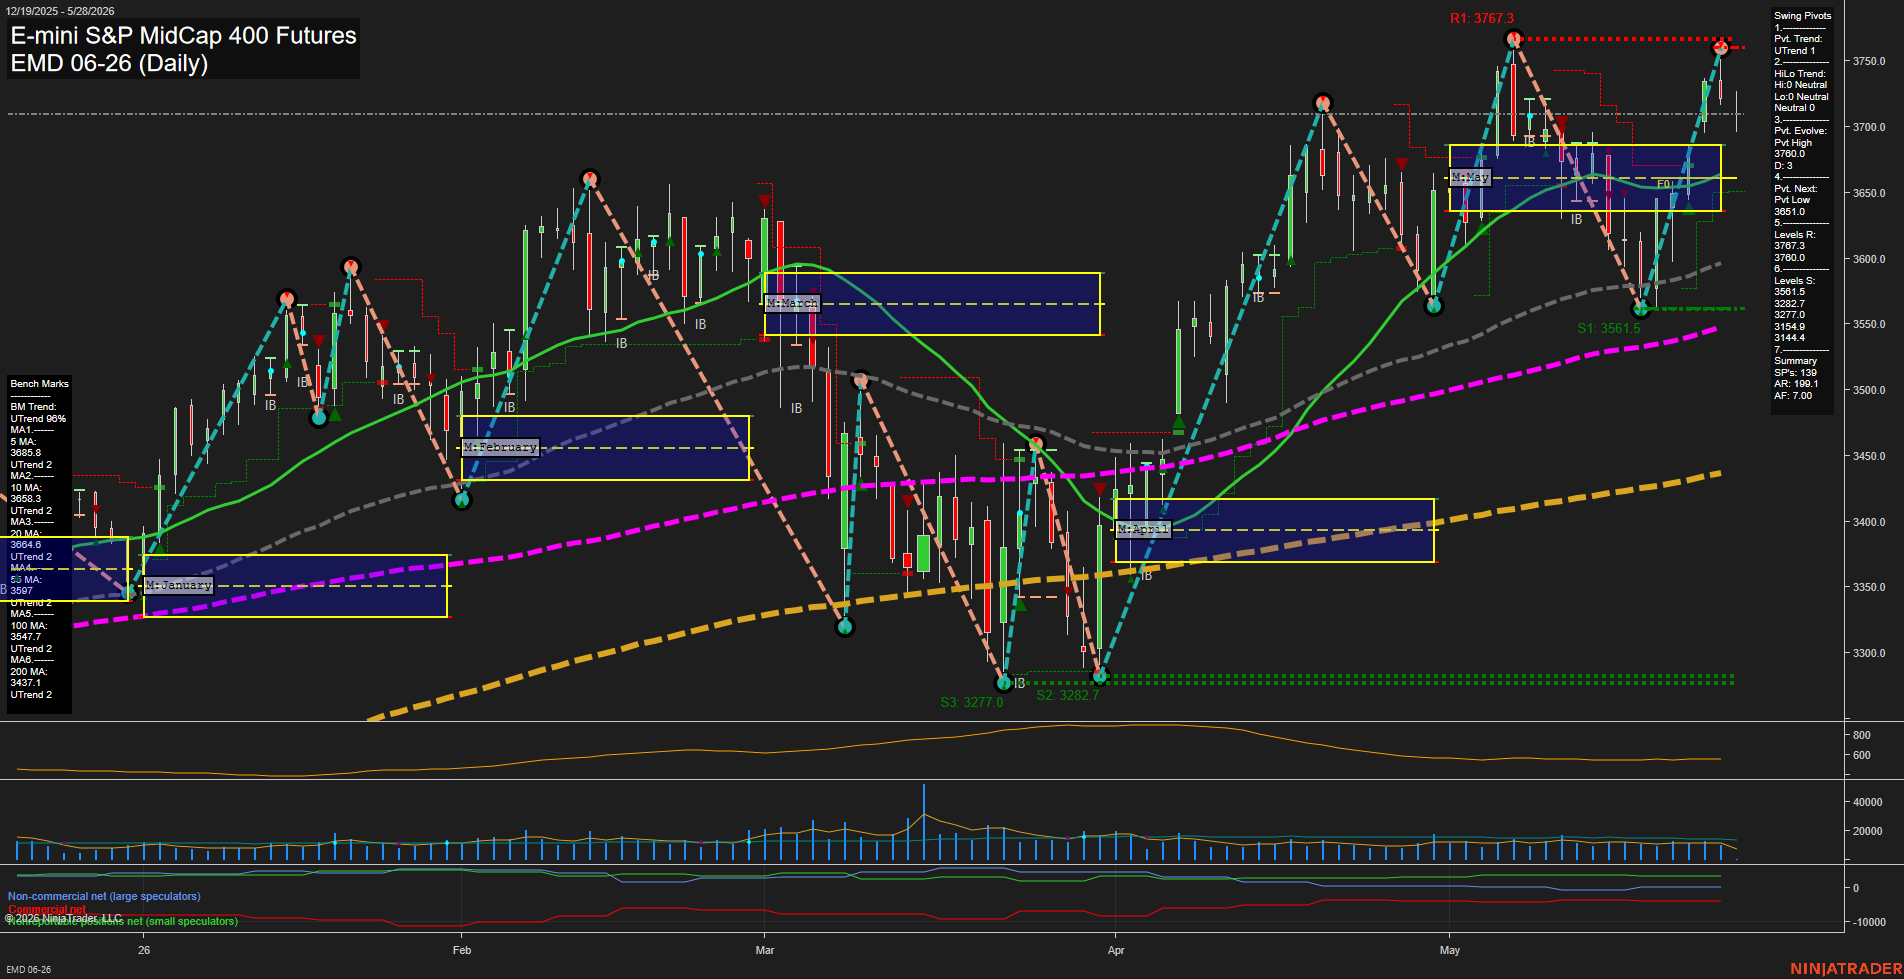
EMD E-mini S&P MidCap 400 Futures Daily Chart Analysis: 2026-May-28 07:02 CT
Price Action
- Last: 3750.0,
- Bars: Large,
- Mom: fast.
WSFG Weekly
- Short-Term
- WSFG Current: 5%
- F0%/NTZ' Bias: Price Above,
- WSFG Trend: Up.
MSFG Month May
- Intermediate-Term
- MSFG Current: 19%
- F0%/NTZ' Bias: Price Above,
- MSFG Trend: Up.
YSFG Year 2026
- Long-Term
- YSFG Current: 47%
- F0%/NTZ' Bias: Price Above,
- YSFG Trend: Up.
Swing Pivots
- (Short-Term) 1. Pvt. Trend: UTrend,
- (Intermediate-Term) 2. HiLo Trend: UTrend,
- 3. Pvt. Evolve: Pvt High 3767.3,
- 4. Pvt. Next: Pvt Low 3851.0,
- 5. Levels R: 3767.3, 3760.0,
- 6. Levels S: 3561.5, 3282.7, 3277.0, 3154.9, 3144.4.
Daily Benchmarks
- (Short-Term) 5 Day: 3885.8 Up Trend,
- (Short-Term) 10 Day: 3685.3 Up Trend,
- (Intermediate-Term) 20 Day: 3804.6 Up Trend,
- (Intermediate-Term) 55 Day: 3597.0 Up Trend,
- (Long-Term) 100 Day: 3547.7 Up Trend,
- (Long-Term) 200 Day: 3437.1 Up Trend.
Additional Metrics
Recent Trade Signals
- 26 May 2026: Long EMD 06-26 @ 3729 Signals.USAR-WSFG
- 26 May 2026: Long EMD 06-26 @ 3705.5 Signals.USAR-MSFG
- 20 May 2026: Long EMD 06-26 @ 3637.3 Signals.USAR.TR120
Overall Rating
- Short-Term: Bullish,
- Intermediate-Term: Bullish,
- Long-Term: Bullish.
Key Insights Summary
Price is pressing back into the upper end of the monthly and yearly session fib structure with strong bullish alignment across weekly, monthly, and yearly grids. The daily chart shows a decisive recovery from the spring pullback, with higher lows rebuilding into a fresh swing-high test near the prior resistance band at 3767.3. Benchmarks are stacked in constructive order and all are trending up, reinforcing the broader uptrend. Recent USAR signals remain aligned with the rally phase, and the pivot structure shows an active upward swing sequence with resistance being tested near the recent highs after a strong impulse leg.
Chart Analysis ATS AI Generated: 2026-05-28 07:02 for Informational use only, not trading advice. Terms and Risk Disclosure Copyright © 2026. Algo Trading Systems LLC.