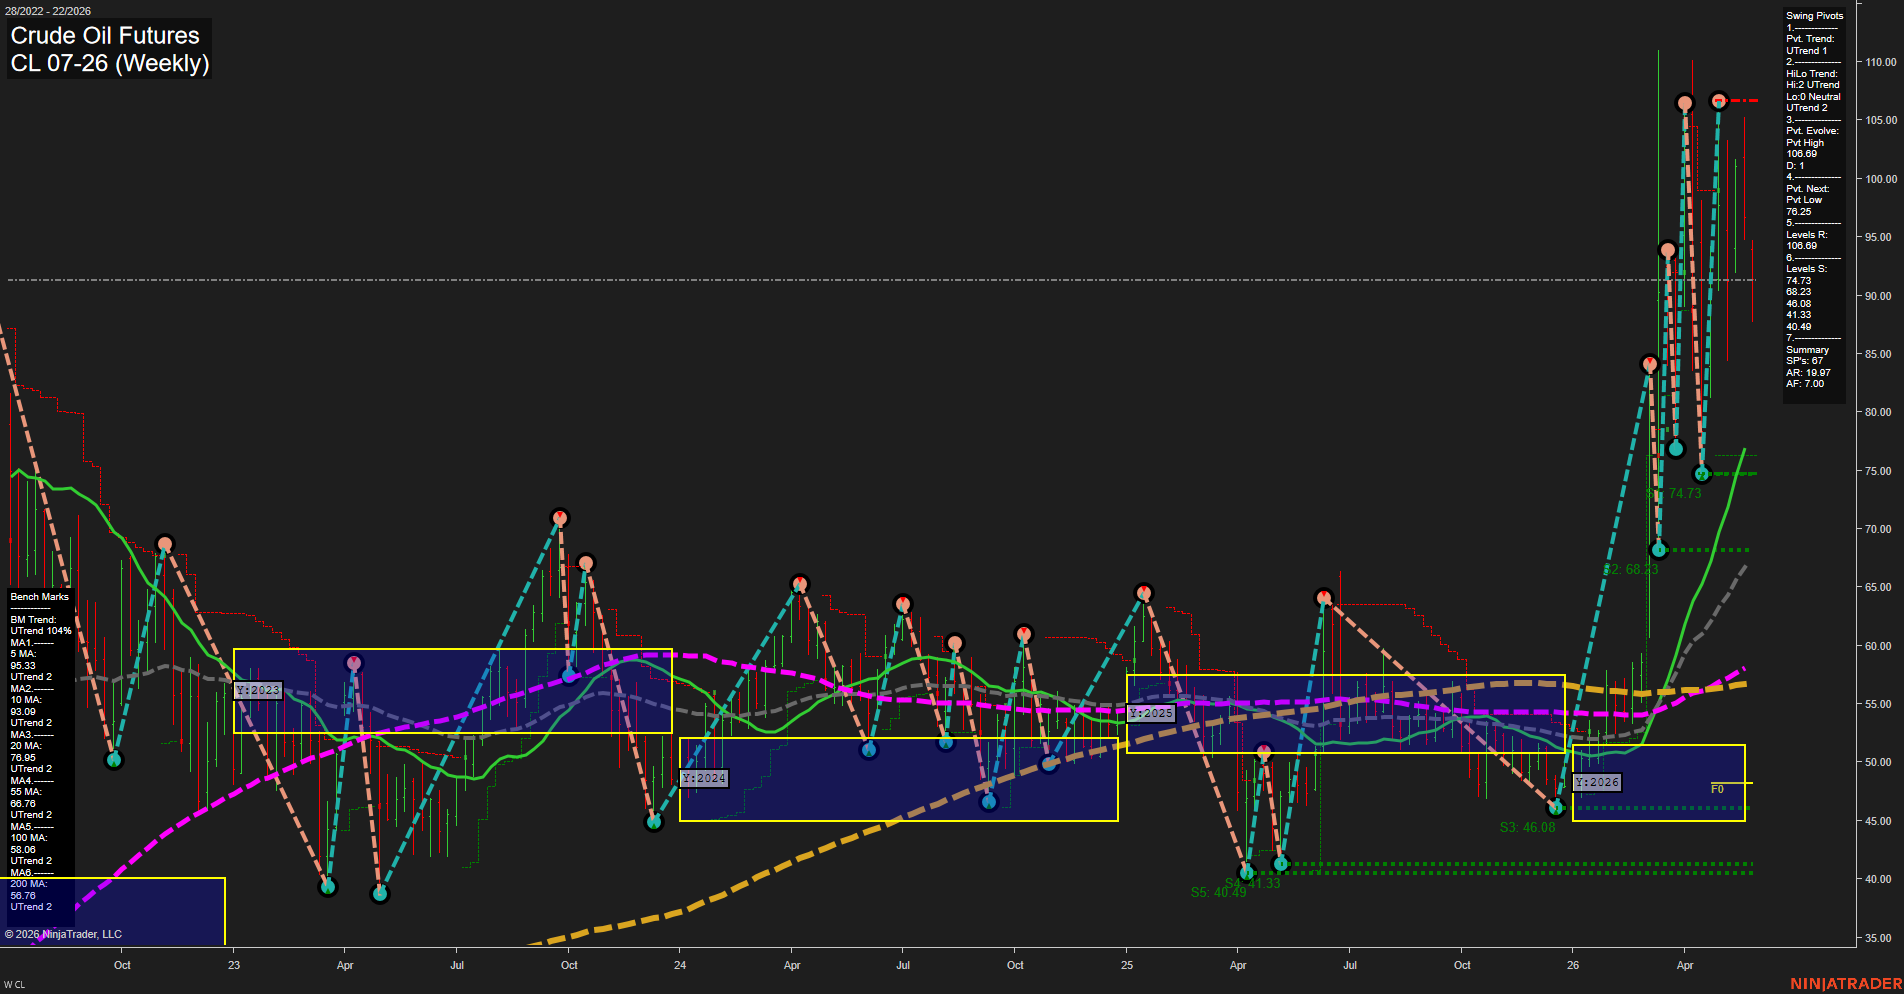
CL Crude Oil Futures Weekly Chart Analysis: 2026-May-28 07:02 CT
Price Action
- Last: 92.00,
- Bars: Large,
- Mom: fast.
WSFG Weekly
- Short-Term
- WSFG Current: -20%
- F0%/NTZ' Bias: Price Below,
- WSFG Trend: Down.
MSFG Month May
- Intermediate-Term
- MSFG Current: -41%
- F0%/NTZ' Bias: Price Below,
- MSFG Trend: Down.
YSFG Year 2026
- Long-Term
- YSFG Current: 131%
- F0%/NTZ' Bias: Price Above,
- YSFG Trend: Up.
Swing Pivots
- (Short-Term) 1. Pvt. Trend: UTrend,
- (Intermediate-Term) 2. HiLo Trend: UTrend,
- 3. Pvt. Evolve: Pvt High 106.69,
- 4. Pvt. Next: Pvt Low 78.25,
- 5. Levels R: 106.69,
- 6. Levels S: 74.73, 68.23, 46.08, 41.33, 40.49.
Weekly Benchmarks
- (Short-Term) 5 Day: 95.53 Down Trend,
- (Short-Term) 10 Day: 93.09 Down Trend,
- (Intermediate-Term) 20 Day: 78.96 Up Trend,
- (Intermediate-Term) 55 Day: 68.76 Up Trend,
- (Long-Term) 100 Day: 58.06 Up Trend,
- (Long-Term) 200 Day: 56.78 Up Trend.
Recent Trade Signals
- 27 May 2026: Short CL 07-26 @ 91.54 Signals.USAR-WSFG
- 25 May 2026: Short CL 07-26 @ 91.01 Signals.USAR.TR720
- 22 May 2026: Short CL 07-26 @ 97.55 Signals.USAR-MSFG
- 20 May 2026: Short CL 07-26 @ 99.23 Signals.USAR.TR120
Overall Rating
- Short-Term: Bearish,
- Intermediate-Term: Bearish,
- Long-Term: Bullish.
Key Insights Summary
Crude oil is in a powerful weekly expansion after a deep multi-year base and a sharp 2026 breakout, with price now trading well above the yearly fib structure while still sitting below the short-term weekly and monthly session bias. The short-term tape is pressing lower from an elevated swing high near 106.69, and the recent sequence of short signals aligns with the weakness in WSFG and MSFG. At the same time, the longer-term structure remains constructive: the yearly grid is still above the f0% zone, the pivot trend is still higher, and the 20-day through 200-day benchmarks remain stacked in an uptrend. The chart shows a fast, volatile retracement from the peak area into a broad consolidation band, with the current weekly action located between the upper breakout region and the prior support cluster, reflecting a transition from impulse to digestion rather than a clean trend reversal.
Chart Analysis ATS AI Generated: 2026-05-28 07:02 for Informational use only, not trading advice. Terms and Risk Disclosure Copyright © 2026. Algo Trading Systems LLC.