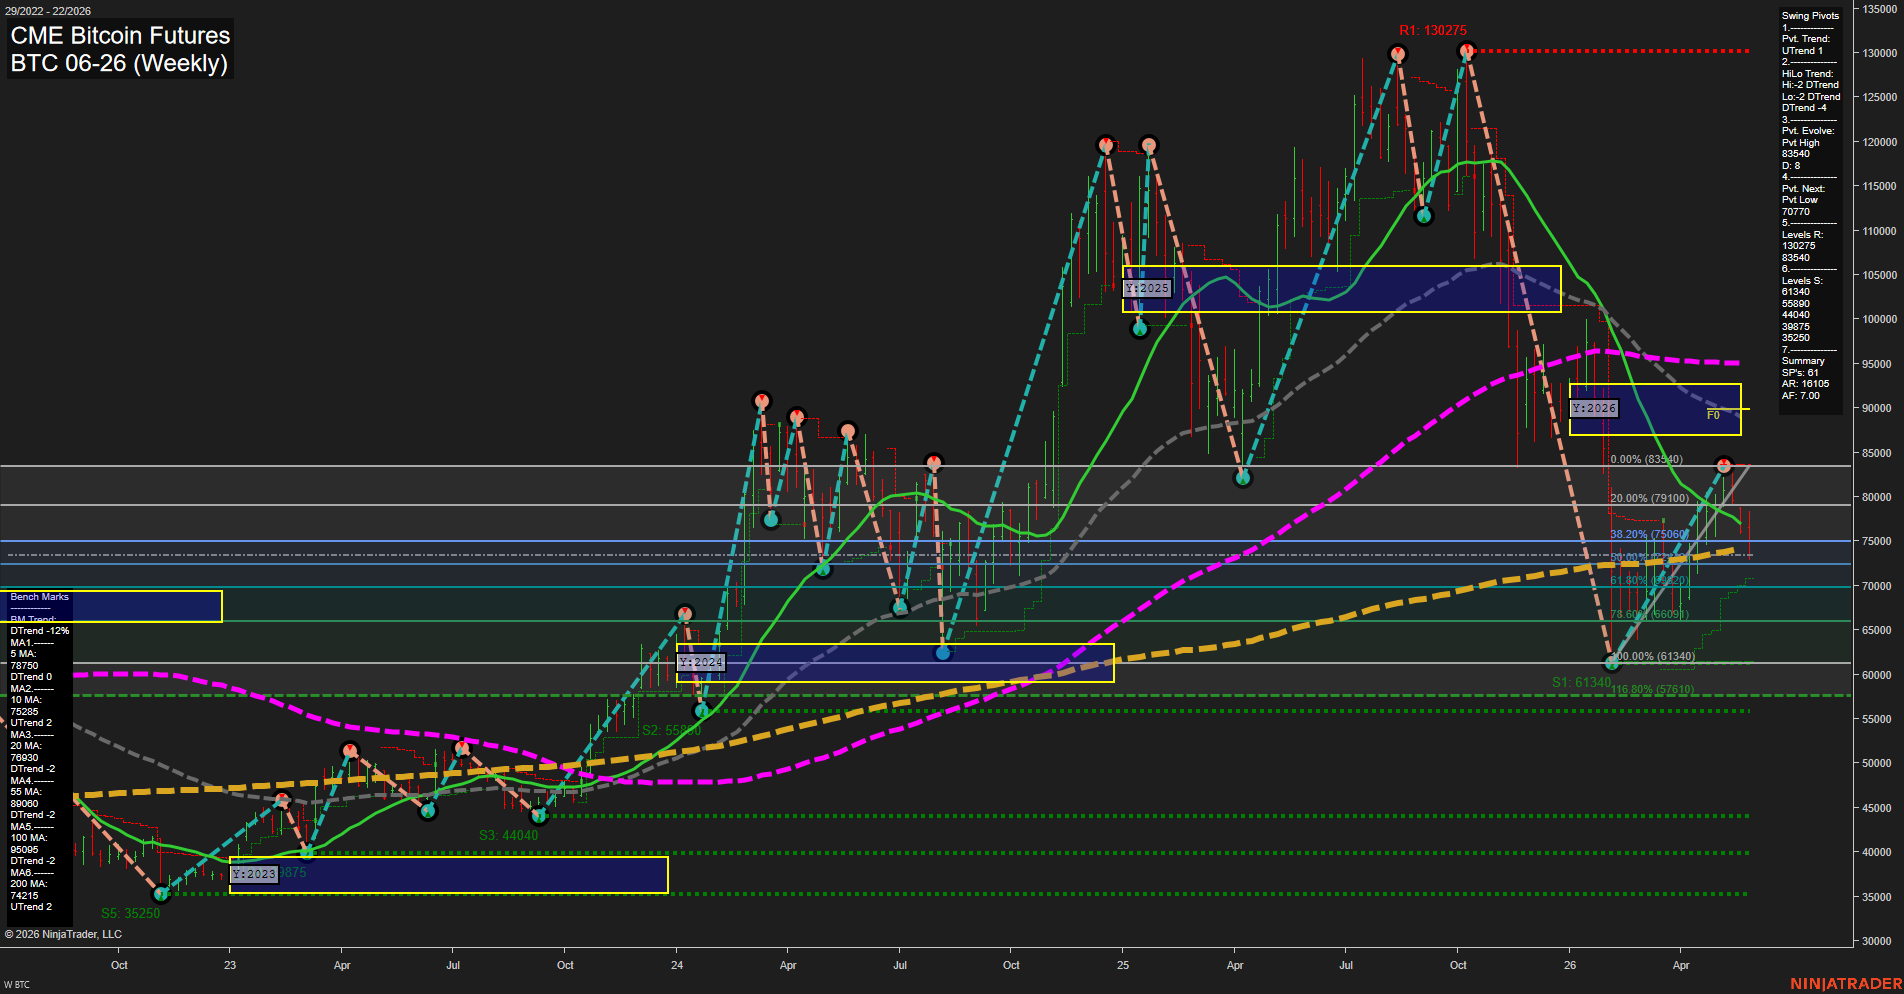
BTC CME Bitcoin Futures Weekly Chart Analysis: 2026-May-28 07:01 CT
Price Action
- Last: 76055,
- Bars: Large,
- Mom: Fast.
WSFG Weekly
- Short-Term
- WSFG Current: -73%
- F0%/NTZ' Bias: Price Below,
- WSFG Trend: Down.
MSFG Month May
- Intermediate-Term
- MSFG Current: -31%
- F0%/NTZ' Bias: Price Below,
- MSFG Trend: Down.
YSFG Year 2026
- Long-Term
- YSFG Current: -57%
- F0%/NTZ' Bias: Price Below,
- YSFG Trend: Down.
Swing Pivots
- (Short-Term) 1. Pvt. Trend: UTrend,
- (Intermediate-Term) 2. HiLo Trend: DTrend,
- 3. Pvt. Evolve: Pvt High 83540,
- 4. Pvt. Next: Pvt Low 70770,
- 5. Levels R: 130275, 83540,
- 6. Levels S: 61340, 55890, 44040, 39875, 35250.
Weekly Benchmarks
- (Short-Term) 5 Day: 78750 Down Trend,
- (Short-Term) 10 Day: 75285 Up Trend,
- (Intermediate-Term) 20 Day: 76930 Down Trend,
- (Intermediate-Term) 55 Day: 89060 Down Trend,
- (Long-Term) 100 Day: 95095 Down Trend,
- (Long-Term) 200 Day: 74215 Up Trend.
Recent Trade Signals
- 26 May 2026: Short BTC 06-26 @ 76055 Signals.USAR-MSFG
- 26 May 2026: Short BTC 06-26 @ 76055 Signals.USAR-WSFG
Overall Rating
- Short-Term: Bearish,
- Intermediate-Term: Bearish,
- Long-Term: Neutral.
Key Insights Summary
Weekly BTC futures are in a broad corrective phase after a major rally and subsequent peak/reversal sequence. Price is trading below the weekly, monthly, and yearly session fib centers, keeping all three session grids aligned to the downside. The recent weekly selloff has driven price back into a lower retracement area near the 50% to 61.8% zone, where prior support and benchmark overlap are creating a reactive bounce attempt. Swing structure still shows a short-term UTrend pivot state, but the broader HiLo trend remains DTrend, and resistance is stacked overhead at 83,540 then 130,275. Support layers are clustered at 61,340, 55,890, 44,040, 39,875, and 35,250, showing a market that has transitioned from impulse expansion into a deep retracement and consolidation-under-pressure phase. Moving averages remain mixed to negative on the medium-term stack, while the long-term 200-day still trends up, leaving the bigger picture less damaged than the weekly and monthly structure. The recent short signals on both WSFG and MSFG reinforce the downside bias in the current swing sequence.
Chart Analysis ATS AI Generated: 2026-05-28 07:01 for Informational use only, not trading advice. Terms and Risk Disclosure Copyright © 2026. Algo Trading Systems LLC.