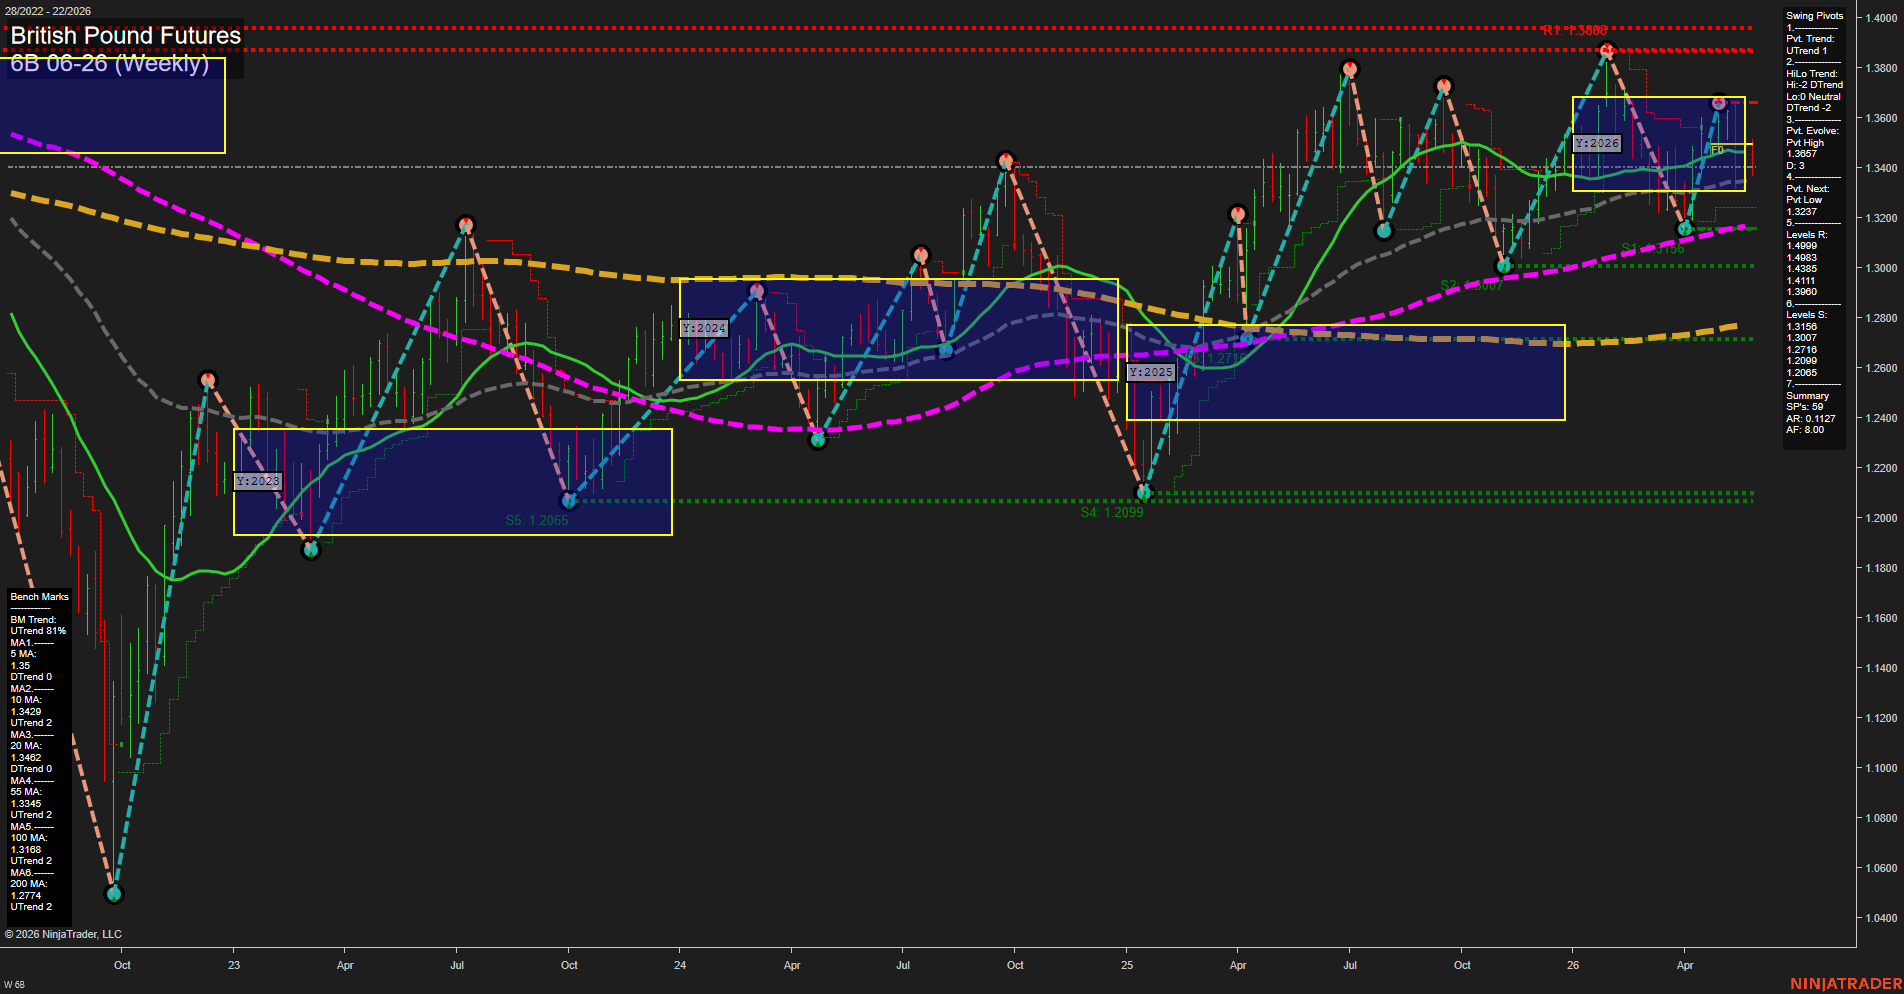
6B British Pound Futures Weekly Chart Analysis: 2026-May-28 07:00 CT
Price Action
- Last: 1.3657,
- Bars: Medium,
- Mom: average.
WSFG Weekly
- Short-Term
- WSFG Current: -21%
- F0%/NTZ' Bias: Price Below,
- WSFG Trend: Down.
MSFG Month May
- Intermediate-Term
- MSFG Current: -64%
- F0%/NTZ' Bias: Price Below,
- MSFG Trend: Down.
YSFG Year 2026
- Long-Term
- YSFG Current: -5%
- F0%/NTZ' Bias: Price Below,
- YSFG Trend: Down.
Swing Pivots
- (Short-Term) 1. Pvt. Trend: UTrend,
- (Intermediate-Term) 2. HiLo Trend: DTrend,
- 3. Pvt. Evolve: Pvt High 1.3857,
- 4. Pvt. Next: Pvt Low 1.3237,
- 5. Levels R: 1.4999, 1.4983, 1.4385, 1.4111, 1.3960,
- 6. Levels S: 1.3158, 1.3007, 1.2716, 1.2099, 1.2065.
Weekly Benchmarks
- (Short-Term) 5 Day: 1.3500 Down Trend,
- (Short-Term) 10 Day: 1.3429 Up Trend,
- (Intermediate-Term) 20 Day: 1.3462 Down Trend,
- (Intermediate-Term) 55 Day: 1.3345 Up Trend,
- (Long-Term) 100 Day: 1.3168 Up Trend,
- (Long-Term) 200 Day: 1.2774 Up Trend.
Recent Trade Signals
- 28 May 2026: Short 6B 06-26 @ 1.3403 Signals.USAR-WSFG
Overall Rating
- Short-Term: Bearish,
- Intermediate-Term: Bearish,
- Long-Term: Neutral.
Key Insights Summary
The weekly structure remains tactically soft with price holding below the weekly, monthly, and yearly F0%/NTZ references, keeping the session-fib bias aligned to the downside. Swing pivot structure still shows an active UTrend on the short-term pivot read, but the intermediate HiLo trend remains DTrend, which fits a broader corrective-to-distribution style pattern rather than a clean breakout continuation. Price is pressing into the upper part of the recent yearly range, but the repeated tests and failures near the 1.38 area leave a prominent resistance shelf overhead while support sits layered lower around 1.3237, 1.3158, and 1.3007. Benchmark alignment is mixed: the faster averages are closer to price and less uniform, while the 100- and 200-day measures remain in constructive longer-term uptrends, creating a two-way backdrop beneath a still-down seasonal/session-fib profile. Overall, the chart reads as a countertrend rally inside a larger rotational range, with recent structure showing rejection near prior highs and a bias toward continued choppy, headline-sensitive consolidation.
Chart Analysis ATS AI Generated: 2026-05-28 07:00 for Informational use only, not trading advice. Terms and Risk Disclosure Copyright © 2026. Algo Trading Systems LLC.