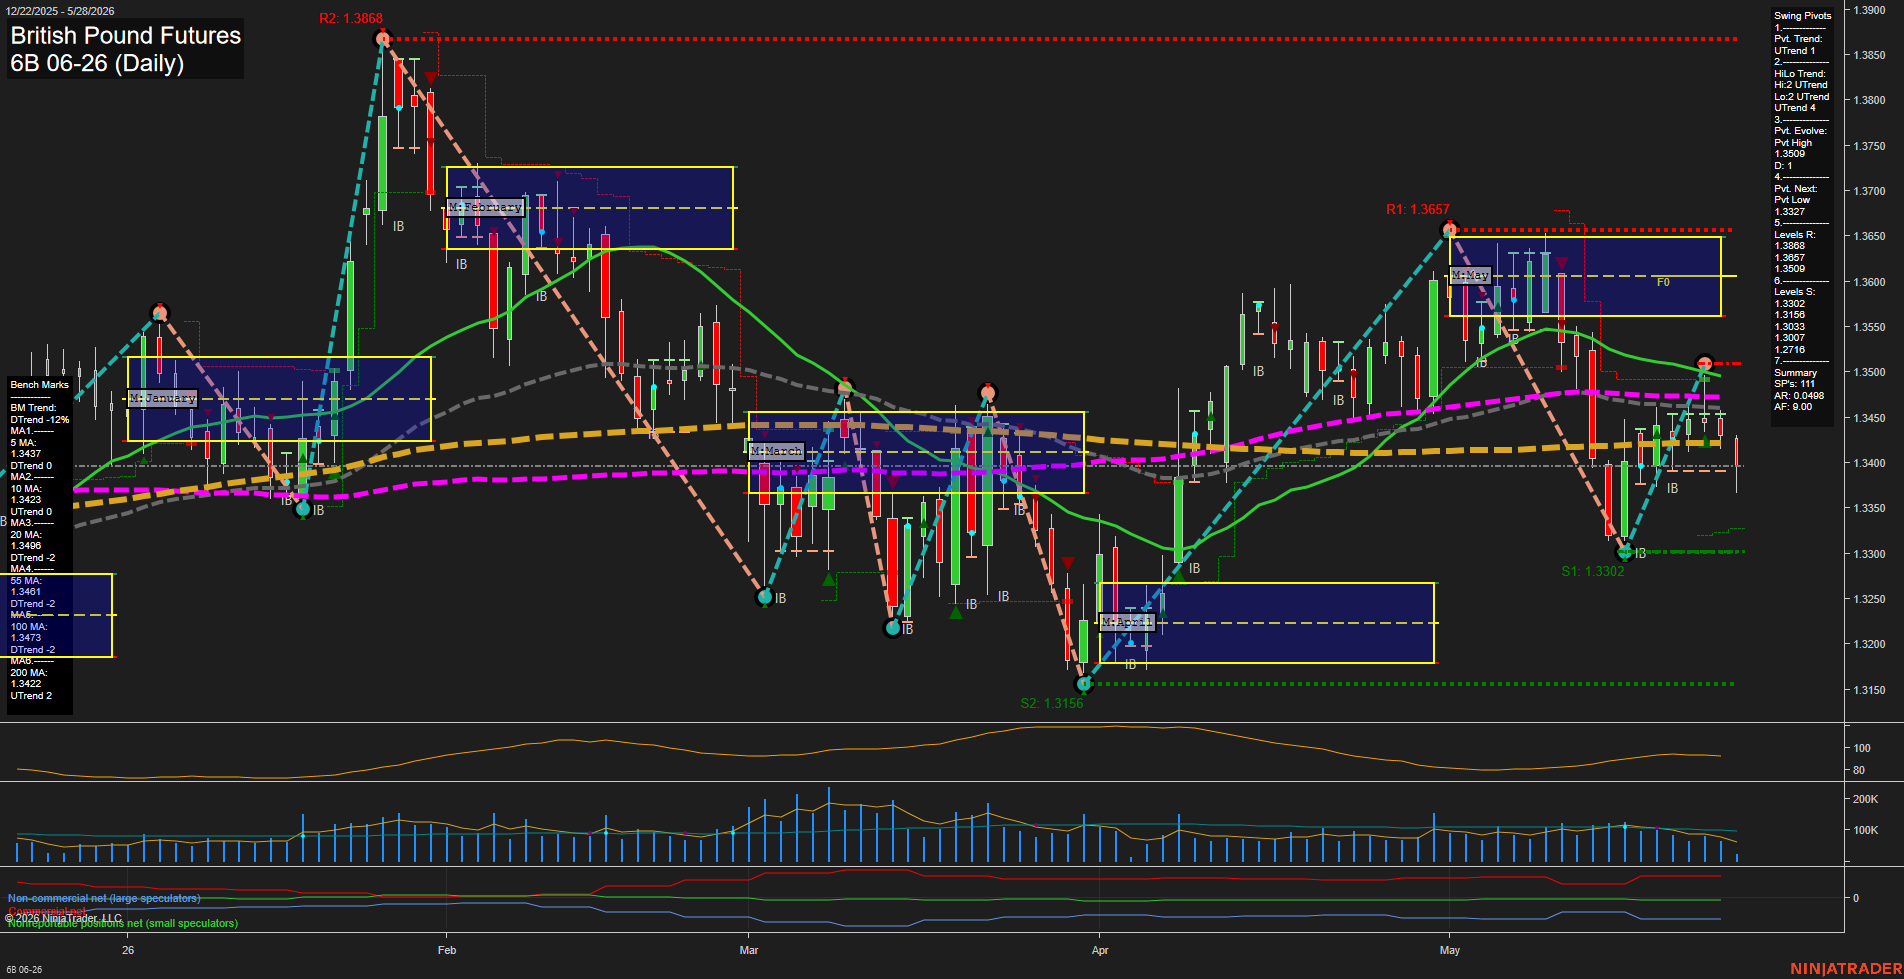
6B British Pound Futures Daily Chart Analysis: 2026-May-28 07:00 CT
Price Action
- Last: 1.3403,
- Bars: Medium,
- Mom: Average.
WSFG Weekly
- Short-Term
- WSFG Current: -21%
- F0%/NTZ' Bias: Price Below,
- WSFG Trend: Down.
MSFG Month May
- Intermediate-Term
- MSFG Current: -64%
- F0%/NTZ' Bias: Price Below,
- MSFG Trend: Down.
YSFG Year 2026
- Long-Term
- YSFG Current: -5%
- F0%/NTZ' Bias: Price Below,
- YSFG Trend: Down.
Swing Pivots
- (Short-Term) 1. Pvt. Trend: UTrend,
- (Intermediate-Term) 2. HiLo Trend: UTrend,
- 3. Pvt. Evolve: Pvt High 1.3509,
- 4. Pvt. Next: Pvt Low 1.3327,
- 5. Levels R: 1.3868, 1.3657, 1.3509,
- 6. Levels S: 1.3302, 1.3156, 1.3007, 1.2716.
Daily Benchmarks
- (Short-Term) 5 Day: 1.3437 Down Trend,
- (Short-Term) 10 Day: 1.3423 Down Trend,
- (Intermediate-Term) 20 Day: 1.3496 Down Trend,
- (Intermediate-Term) 55 Day: 1.3461 Down Trend,
- (Long-Term) 100 Day: 1.3473 Down Trend,
- (Long-Term) 200 Day: 1.3422 Up Trend.
Additional Metrics
Recent Trade Signals
- 28 May 2026: Short 6B 06-26 @ 1.3403 Signals.USAR-WSFG
Overall Rating
- Short-Term: Bearish,
- Intermediate-Term: Bearish,
- Long-Term: Neutral.
Key Insights Summary
British Pound futures are trading beneath the weekly, monthly, and yearly session fib midpoints, keeping the broader structure biased to the downside. The daily swing pivot model remains in an uptrend on the short-term pivot read, but the chart is still working through a corrective phase beneath multiple benchmark averages, with the 5, 10, 20, 55, and 100 day measures all leaning lower or flattening into resistance. Price action shows a decline from the May swing high, a lower high sequence, and a rebound attempt that has so far stalled near the 1.34 area. The pivot map highlights nearby resistance at 1.3509 and then 1.3657, while support layers cluster at 1.3302 and 1.3156, framing a choppy consolidation-to-downside setup. From a swing trader perspective, the tape reflects a downtrend that is pausing rather than reversing, with momentum moderate and volatility still active enough to keep the market responsive to tests of prior support and rejection at moving average resistance.
Chart Analysis ATS AI Generated: 2026-05-28 07:00 for Informational use only, not trading advice. Terms and Risk Disclosure Copyright © 2026. Algo Trading Systems LLC.