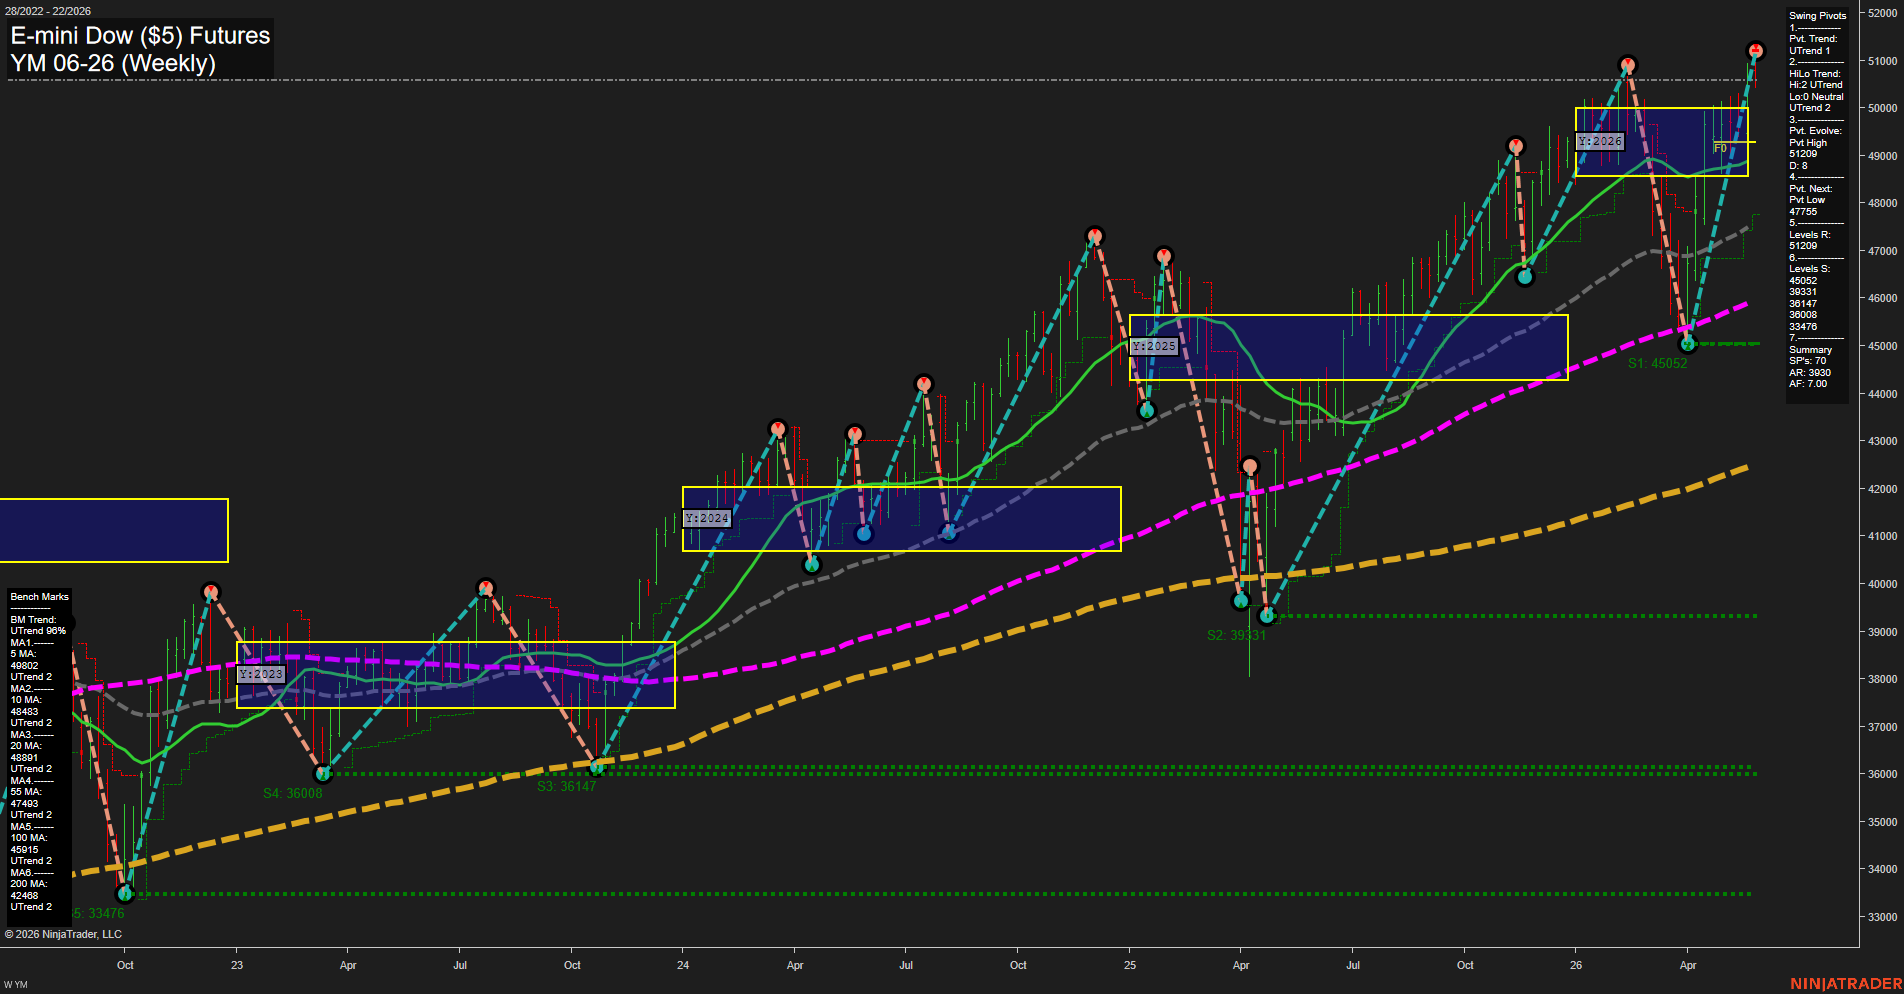
YM E-mini Dow ($5) Futures Weekly Chart Analysis: 2026-May-27 07:08 CT
Price Action
- Last: 50541,
- Bars: Large,
- Mom: fast.
WSFG Weekly
- Short-Term
- WSFG Current: -14%
- F0%/NTZ' Bias: Price Below,
- WSFG Trend: Down.
MSFG Month May
- Intermediate-Term
- MSFG Current: 24%
- F0%/NTZ' Bias: Price Above,
- MSFG Trend: Up.
YSFG Year 2026
- Long-Term
- YSFG Current: 18%
- F0%/NTZ' Bias: Price Above,
- YSFG Trend: Up.
Swing Pivots
- (Short-Term) 1. Pvt. Trend: UTrend,
- (Intermediate-Term) 2. HiLo Trend: UTrend,
- 3. Pvt. Evolve: Pvt High 51209,
- 4. Pvt. Next: Pvt Low 47755,
- 5. Levels R: 51209,
- 6. Levels S: 45052 39331 36147 36008 33476.
Weekly Benchmarks
- (Short-Term) 5 Day: 49802 Up Trend,
- (Short-Term) 10 Day: 48483 Up Trend,
- (Intermediate-Term) 20 Day: 44891 Up Trend,
- (Intermediate-Term) 55 Day: 47493 Up Trend,
- (Long-Term) 100 Day: 45915 Up Trend,
- (Long-Term) 200 Day: 42468 Up Trend.
Recent Trade Signals
- 27 May 2026: Short YM 06-26 @ 50641 Signals.USAR-WSFG
- 26 May 2026: Short YM 06-26 @ 50549 Signals.USAR.TR120
- 22 May 2026: Long YM 06-26 @ 50522 Signals.USAR-MSFG
Overall Rating
- Short-Term: Neutral,
- Intermediate-Term: Bullish,
- Long-Term: Bullish.
Key Insights Summary
The weekly chart shows the Dow holding a major uptrend structure with price pressed near the upper end of the 2026 range after a sharp recovery from the spring selloff. Short-term WSFG remains negative and aligns with the recent short signals, reflecting a weaker weekly session position and a stretched move under the weekly fib midpoint. In contrast, monthly and yearly grids remain firmly positive, keeping the broader swing structure constructive. Swing pivots still point up, and the pivot ladder shows price working close to the 51,209 resistance/high area after reclaiming the prior 2025 and 2024 consolidation zones. All benchmark moving averages are stacked in uptrend mode, with price above every listed average, reinforcing the dominant bullish intermediate and long-term backdrop even as the weekly action shows some near-term fatigue and two-sided rotation near highs.
Chart Analysis ATS AI Generated: 2026-05-27 07:08 for Informational use only, not trading advice. Terms and Risk Disclosure Copyright © 2026. Algo Trading Systems LLC.