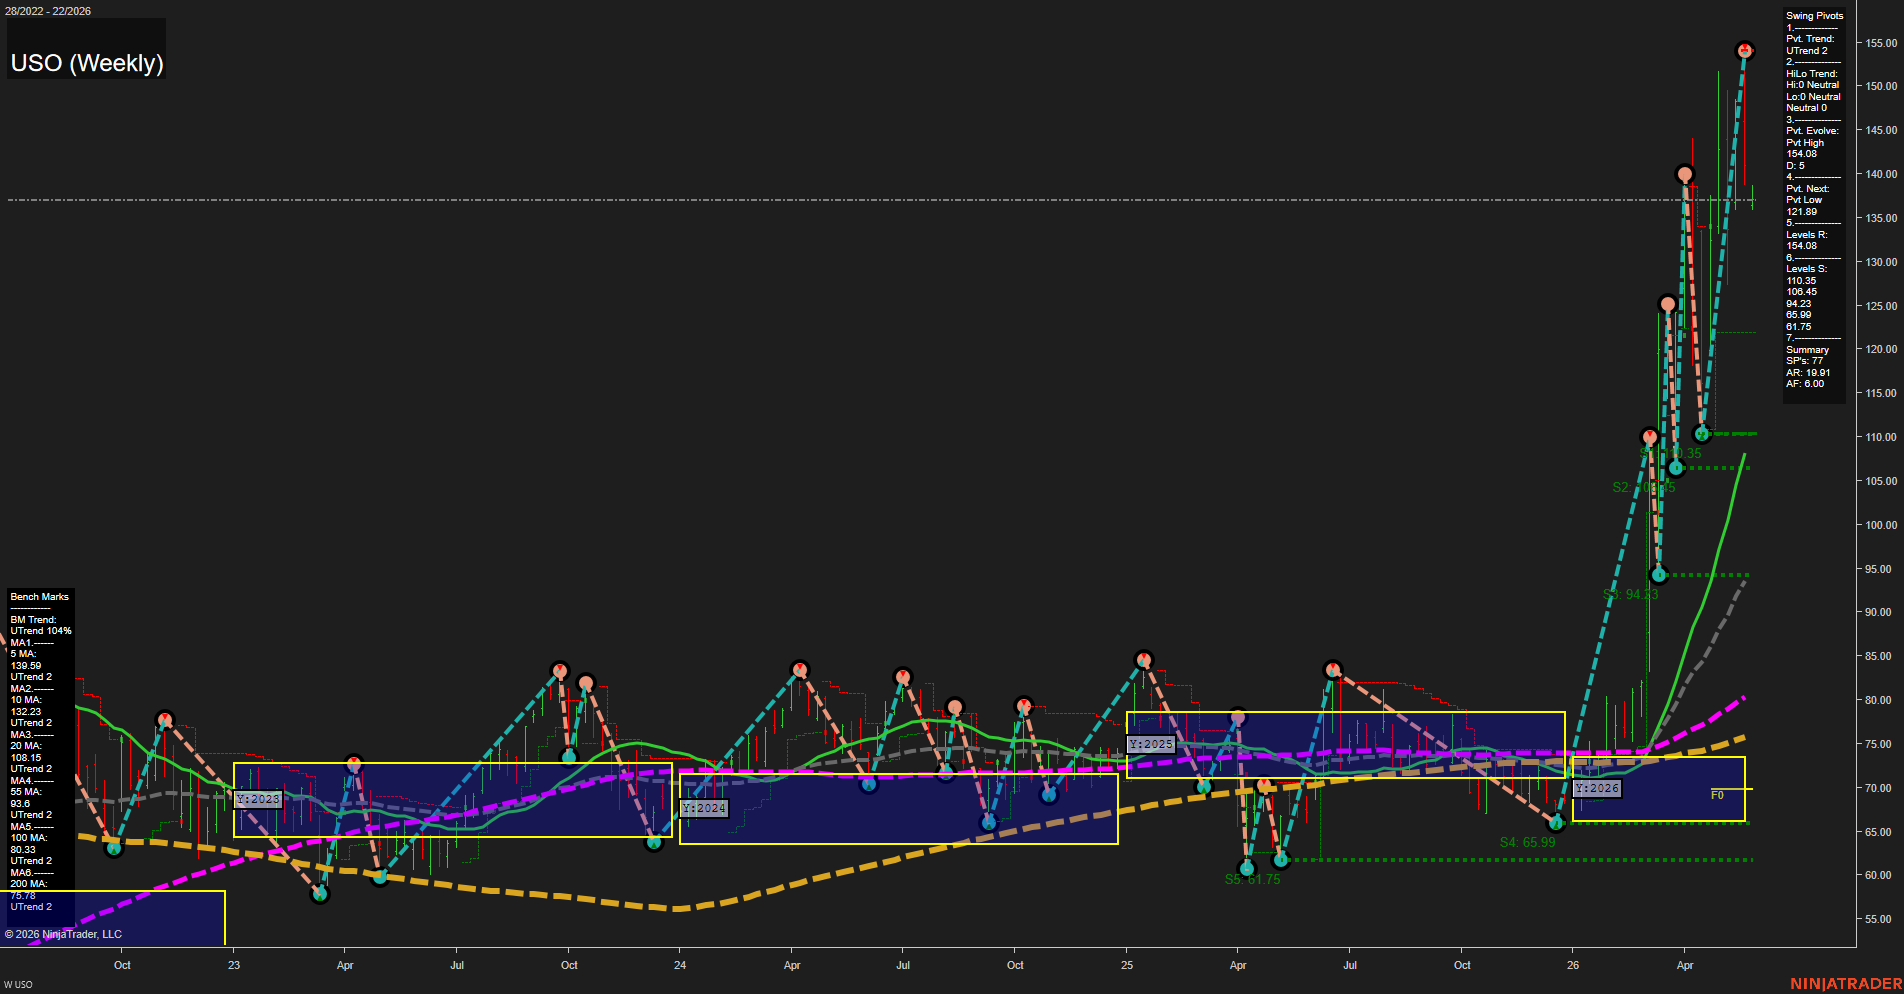
USO United States Oil Fund LP Weekly Chart Analysis: 2026-May-27 07:07 CT
Price Action
- Last: 139.59,
- Bars: Large,
- Mom: fast.
WSFG Weekly
- Short-Term
- WSFG Current: NA%
- F0%/NTZ' Bias: Price Neutral,
- WSFG Trend: Neutral.
MSFG Month May
- Intermediate-Term
- MSFG Current: NA%
- F0%/NTZ' Bias: Price Neutral,
- MSFG Trend: Neutral.
YSFG Year 2026
- Long-Term
- YSFG Current: NA%
- F0%/NTZ' Bias: Price Neutral,
- YSFG Trend: Neutral.
Swing Pivots
- (Short-Term) 1. Pvt. Trend: UTrend,
- (Intermediate-Term) 2. HiLo Trend: UTrend,
- 3. Pvt. Evolve: Pvt High 154.08,
- 4. Pvt. Next: Pvt Low 121.89,
- 5. Levels R: 154.08,
- 6. Levels S: 110.35, 106.45, 94.23, 65.99, 61.75.
Weekly Benchmarks
- (Short-Term) 5 Day: 139.59 Up Trend,
- (Short-Term) 10 Day: 132.23 Up Trend,
- (Intermediate-Term) 20 Day: 108.15 Up Trend,
- (Intermediate-Term) 55 Day: 93.60 Up Trend,
- (Long-Term) 100 Day: 80.33 Up Trend,
- (Long-Term) 200 Day: 75.78 Up Trend.
Overall Rating
- Short-Term: Bullish,
- Intermediate-Term: Bullish,
- Long-Term: Bullish.
Key Insights Summary
USO is in a strong weekly upside expansion with a large, fast-momentum advance that has pushed price well above every benchmark moving average. The pivot structure has flipped into UTrend, and the latest impulse has extended into fresh highs near 154.08 after a sharp vertical rally from the prior base. The weekly, monthly, and yearly fib frameworks are still marked neutral on the grid readout, but the price behavior is decisively trending and shows breakout continuation rather than congestion. The benchmark stack is fully aligned in rising order, with price above the 5, 10, 20, 55, 100, and 200 day averages, reinforcing a bullish trend regime across timeframes. Swing structure now reflects a completed breakout leg with the next lower pivot reference at 121.89 and layered support below at 110.35, 106.45, 94.23, 65.99, and 61.75. From a futures swing trader viewpoint, this is a trend-dominant chart with strong momentum, extended range expansion, and no evidence of bearish pivot deterioration in the current weekly structure.
Chart Analysis ATS AI Generated: 2026-05-27 07:08 for Informational use only, not trading advice. Terms and Risk Disclosure Copyright © 2026. Algo Trading Systems LLC.