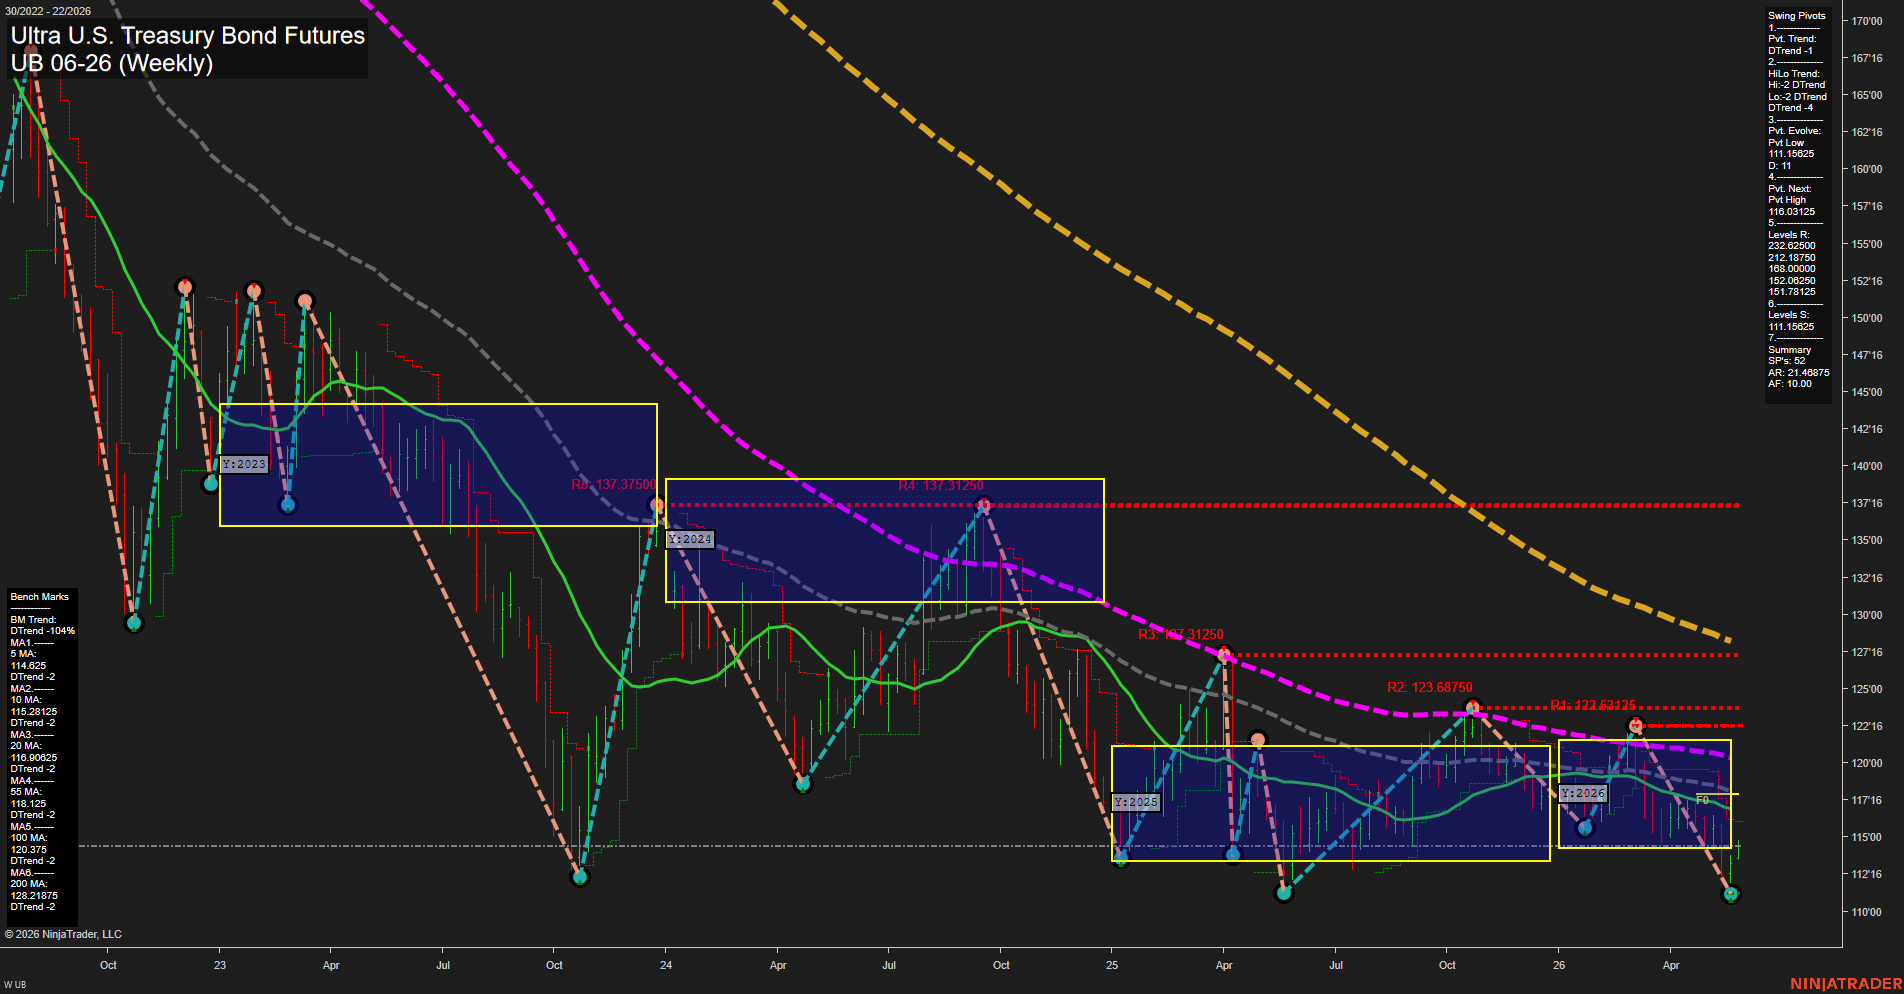
UB Ultra U.S. Treasury Bond Futures Weekly Chart Analysis: 2026-May-27 07:07 CT
Price Action
- Last: 111.16,
- Bars: Medium,
- Mom: fast.
WSFG Weekly
- Short-Term
- WSFG Current: 36%
- F0%/NTZ' Bias: Price Above,
- WSFG Trend: Up.
MSFG Month May
- Intermediate-Term
- MSFG Current: -12%
- F0%/NTZ' Bias: Price Below,
- MSFG Trend: Down.
YSFG Year 2026
- Long-Term
- YSFG Current: -9%
- F0%/NTZ' Bias: Price Below,
- YSFG Trend: Down.
Swing Pivots
- (Short-Term) 1. Pvt. Trend: DTrend,
- (Intermediate-Term) 2. HiLo Trend: DTrend,
- 3. Pvt. Evolve: Pvt Low 111.15625,
- 4. Pvt. Next: Pvt High 116.03125,
- 5. Levels R: 137.31250, 127.31250, 123.68750, 122.62500, 118.00000,
- 6. Levels S: 111.15625, 115.06250, 115.78125, 118.00000, 120.37500.
Weekly Benchmarks
- (Short-Term) 5 Day: 114.625 Down Trend,
- (Short-Term) 10 Day: 115.28125 Down Trend,
- (Intermediate-Term) 20 Day: 116.90625 Down Trend,
- (Intermediate-Term) 55 Day: 118.125 Down Trend,
- (Long-Term) 100 Day: 120.375 Down Trend,
- (Long-Term) 200 Day: 128.21875 Down Trend.
Recent Trade Signals
- 25 May 2026: Long UB 06-26 @ 114.25 Signals.USAR.TR720
- 25 May 2026: Long UB 06-26 @ 114.03125 Signals.USAR-WSFG
- 20 May 2026: Long UB 06-26 @ 112.5 Signals.USAR.TR120
Overall Rating
- Short-Term: Neutral,
- Intermediate-Term: Bearish,
- Long-Term: Bearish.
Key Insights Summary
Bond futures remain in a broad multi-year downtrend, with 2026 still tracking below the yearly and monthly F0%/NTZ centers and the entire benchmark stack leaning lower. The weekly grid is the main counterweight, showing a positive short-term bias after recent recovery attempts, but price has rolled back down near the 111 area and the pivot structure remains DTrend across both short and intermediate swing readings. The chart shows a classic series of lower highs and lower lows with repeated rejection from overhead resistance zones, while the latest swing low has reset the short-term evolve state to a new pivot low. Recent long signals captured the rebound leg, yet the dominant technical backdrop is still pressuring toward a bearish intermediate and long-term posture as price remains beneath every major moving average.
Chart Analysis ATS AI Generated: 2026-05-27 07:07 for Informational use only, not trading advice. Terms and Risk Disclosure Copyright © 2026. Algo Trading Systems LLC.