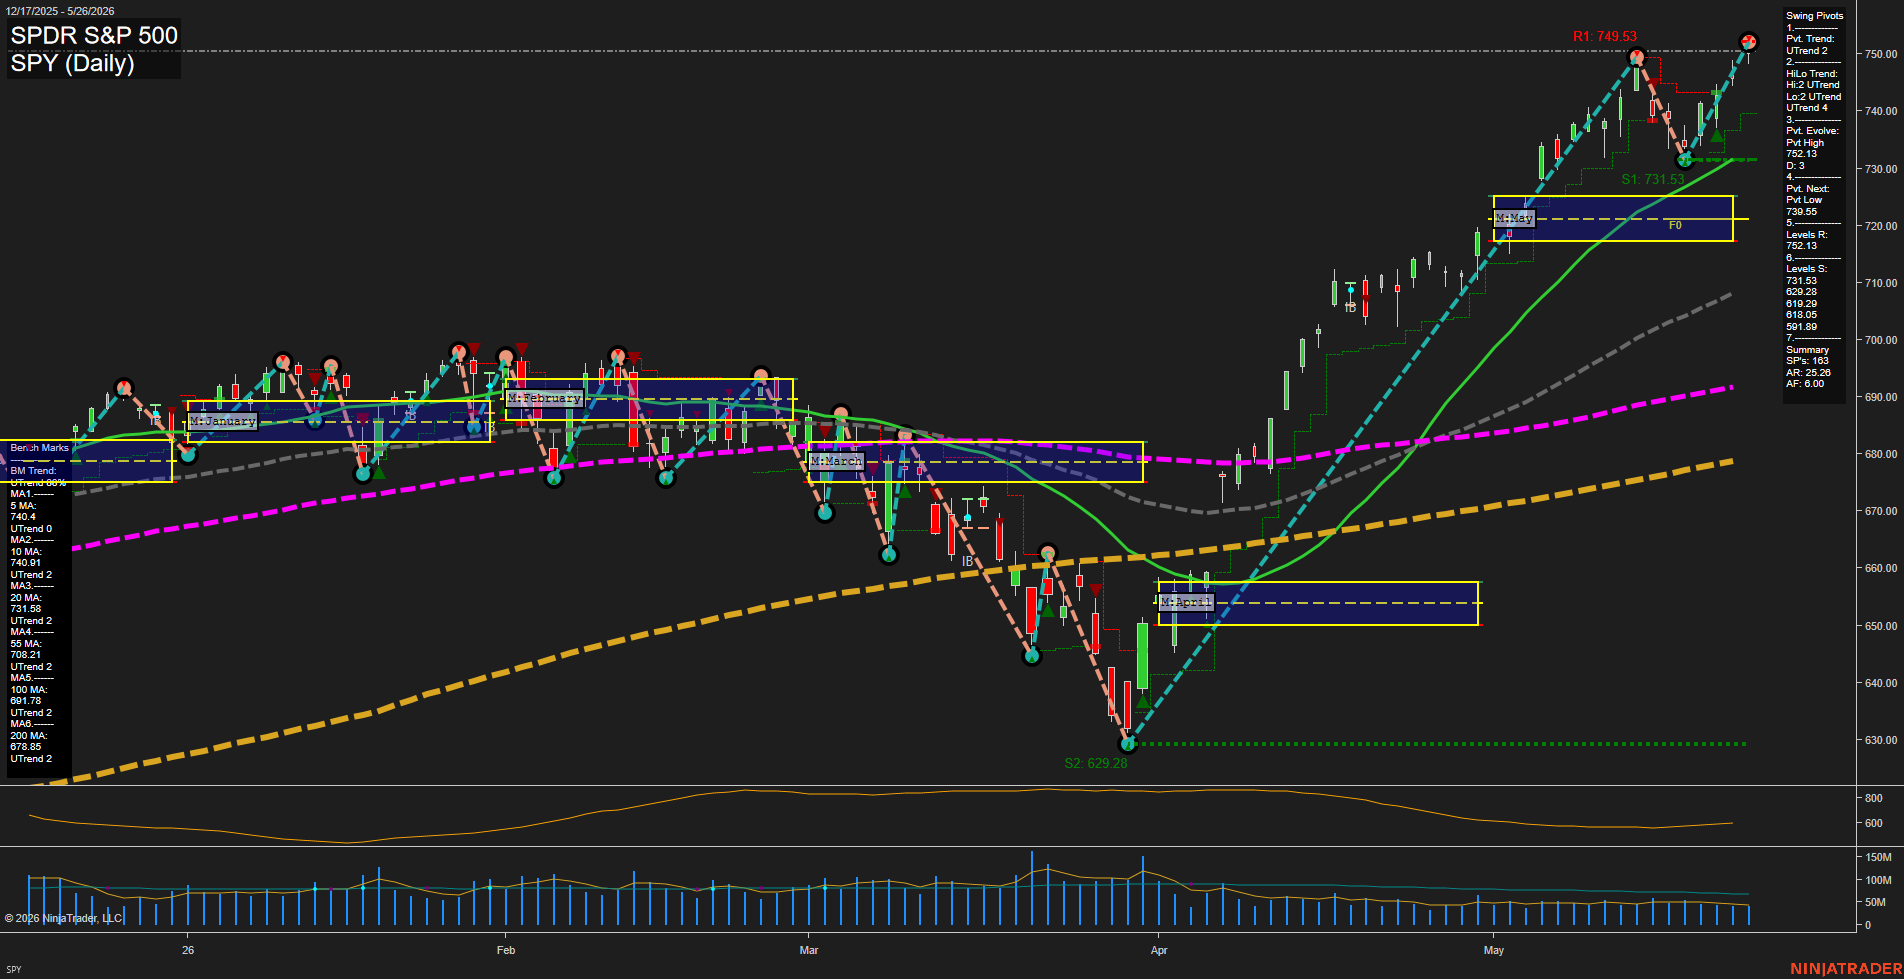
SPY SPDR S&P 500 Daily Chart Analysis: 2026-May-27 07:07 CT
Price Action
- Last: 749.53,
- Bars: Large,
- Mom: fast.
WSFG Weekly
- Short-Term
- WSFG Current: NA%
- F0%/NTZ' Bias: Price Neutral,
- WSFG Trend: Neutral.
MSFG Month May
- Intermediate-Term
- MSFG Current: NA%
- F0%/NTZ' Bias: Price Neutral,
- MSFG Trend: Neutral.
YSFG Year 2026
- Long-Term
- YSFG Current: NA%
- F0%/NTZ' Bias: Price Neutral,
- YSFG Trend: Neutral.
Swing Pivots
- (Short-Term) 1. Pvt. Trend: UTrend,
- (Intermediate-Term) 2. HiLo Trend: UTrend,
- 3. Pvt. Evolve: Pvt High 752.13,
- 4. Pvt. Next: Pvt Low 739.55,
- 5. Levels R: 752.13,
- 6. Levels S: 731.53, 629.28, 619.29, 618.05, 591.89.
Daily Benchmarks
- (Short-Term) 5 Day: 740.4 Up Trend,
- (Short-Term) 10 Day: 740.91 Up Trend,
- (Intermediate-Term) 20 Day: 731.58 Up Trend,
- (Intermediate-Term) 55 Day: 708.21 Up Trend,
- (Long-Term) 100 Day: 691.78 Up Trend,
- (Long-Term) 200 Day: 678.85 Up Trend.
Additional Metrics
- ATR: 564,
- VOLMA: 47470907.
Overall Rating
- Short-Term: Bullish,
- Intermediate-Term: Bullish,
- Long-Term: Bullish.
Key Insights Summary
SPY is trading at a fresh high with a strong impulsive advance, showing a fast momentum phase and a clear sequence of higher highs and higher lows. The short-term pivot structure remains in UTrend with the next downside pivot level marked lower at 739.55, while the current resistance pivot is 752.13. Price is holding well above all benchmark moving averages, and the alignment of the 20, 55, 100, and 200 day benchmarks confirms a sustained bullish trend across timeframes. The monthly session fib grid is centered in a neutral zone, but price has already moved decisively above prior consolidation bands, reflecting a breakout-and-rally continuation profile rather than a chop or reversal setup. The swing trader view is that trend strength remains dominant, with the market in an expanded range after a strong recovery and breakout sequence.
Chart Analysis ATS AI Generated: 2026-05-27 07:07 for Informational use only, not trading advice. Terms and Risk Disclosure Copyright © 2026. Algo Trading Systems LLC.