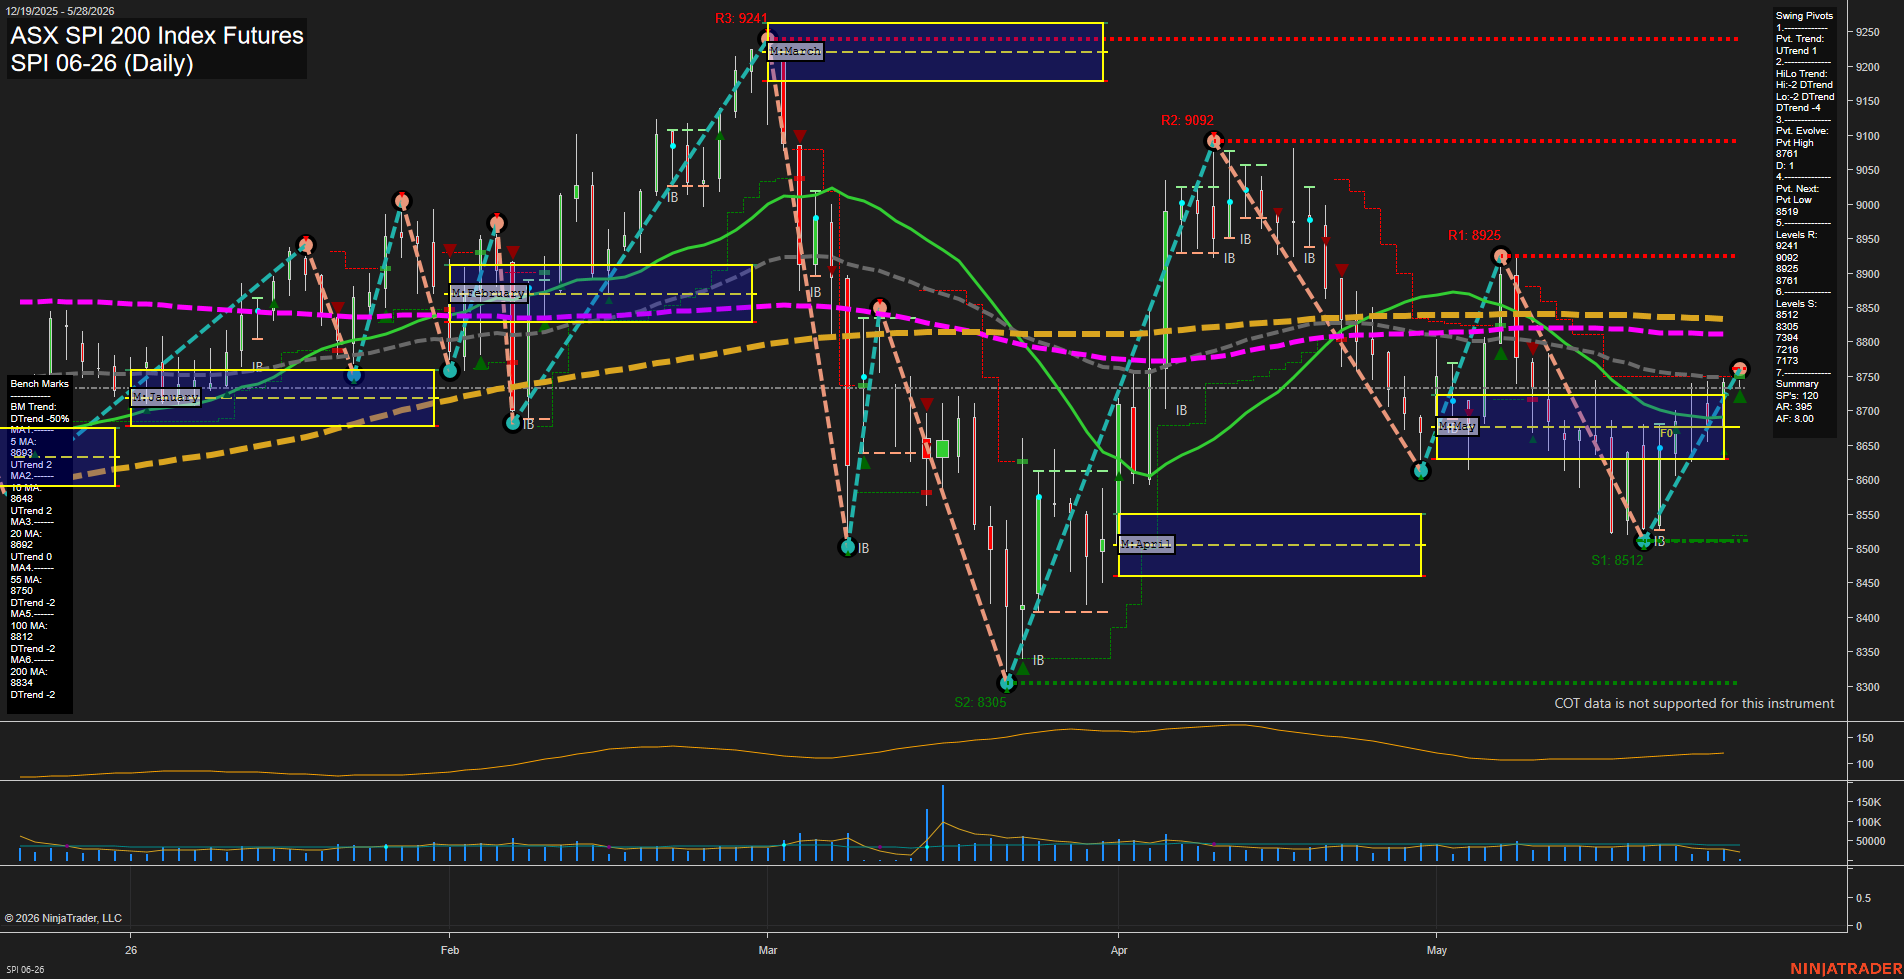
SPI ASX SPI 200 Index Futures Daily Chart Analysis: 2026-May-27 07:06 CT
Price Action
- Last: 8717,
- Bars: Small,
- Mom: average.
WSFG Weekly
- Short-Term
- WSFG Current: NA%
- F0%/NTZ' Bias: Price Neutral,
- WSFG Trend: Neutral.
MSFG Month May
- Intermediate-Term
- MSFG Current: NA%
- F0%/NTZ' Bias: Price Neutral,
- MSFG Trend: Neutral.
YSFG Year 2026
- Long-Term
- YSFG Current: NA%
- F0%/NTZ' Bias: Price Neutral,
- YSFG Trend: Neutral.
Swing Pivots
- (Short-Term) 1. Pvt. Trend: UTrend,
- (Intermediate-Term) 2. HiLo Trend: DTrend,
- 3. Pvt. Evolve: Pvt High 8761,
- 4. Pvt. Next: Pvt Low 8519,
- 5. Levels R: 9241, 9092, 8925, 8761,
- 6. Levels S: 8512, 8305, 7394, 7216, 7173.
Daily Benchmarks
- (Short-Term) 5 Day: 8693 Up Trend,
- (Short-Term) 10 Day: 8648 Up Trend,
- (Intermediate-Term) 20 Day: 8692 Up Trend,
- (Intermediate-Term) 55 Day: 8750 Down Trend,
- (Long-Term) 100 Day: 8812 Down Trend,
- (Long-Term) 200 Day: 8834 Down Trend.
Additional Metrics
Overall Rating
- Short-Term: Bullish,
- Intermediate-Term: Neutral,
- Long-Term: Bearish.
Key Insights Summary
Price is rotating back up from the 8512/8519 support area toward the 8761 pivot high zone, with the short-term pivot structure turning up and the 5, 10, and 20 day benchmarks aligned in a modest uptrend. The daily action remains inside a broader recovery attempt after the prior selloff from the March peak, but the intermediate and long-term benchmark stack is still bearish with the 55, 100, and 200 day averages all declining. The May monthly session fib grid remains centered around neutral territory, so the chart is showing a rebound inside a larger corrective sequence rather than a clean higher-timeframe trend. Key overhead reference levels remain 8761, then 8925 and 9092, while support is anchored by 8512 and 8305.
Chart Analysis ATS AI Generated: 2026-05-27 07:06 for Informational use only, not trading advice. Terms and Risk Disclosure Copyright © 2026. Algo Trading Systems LLC.