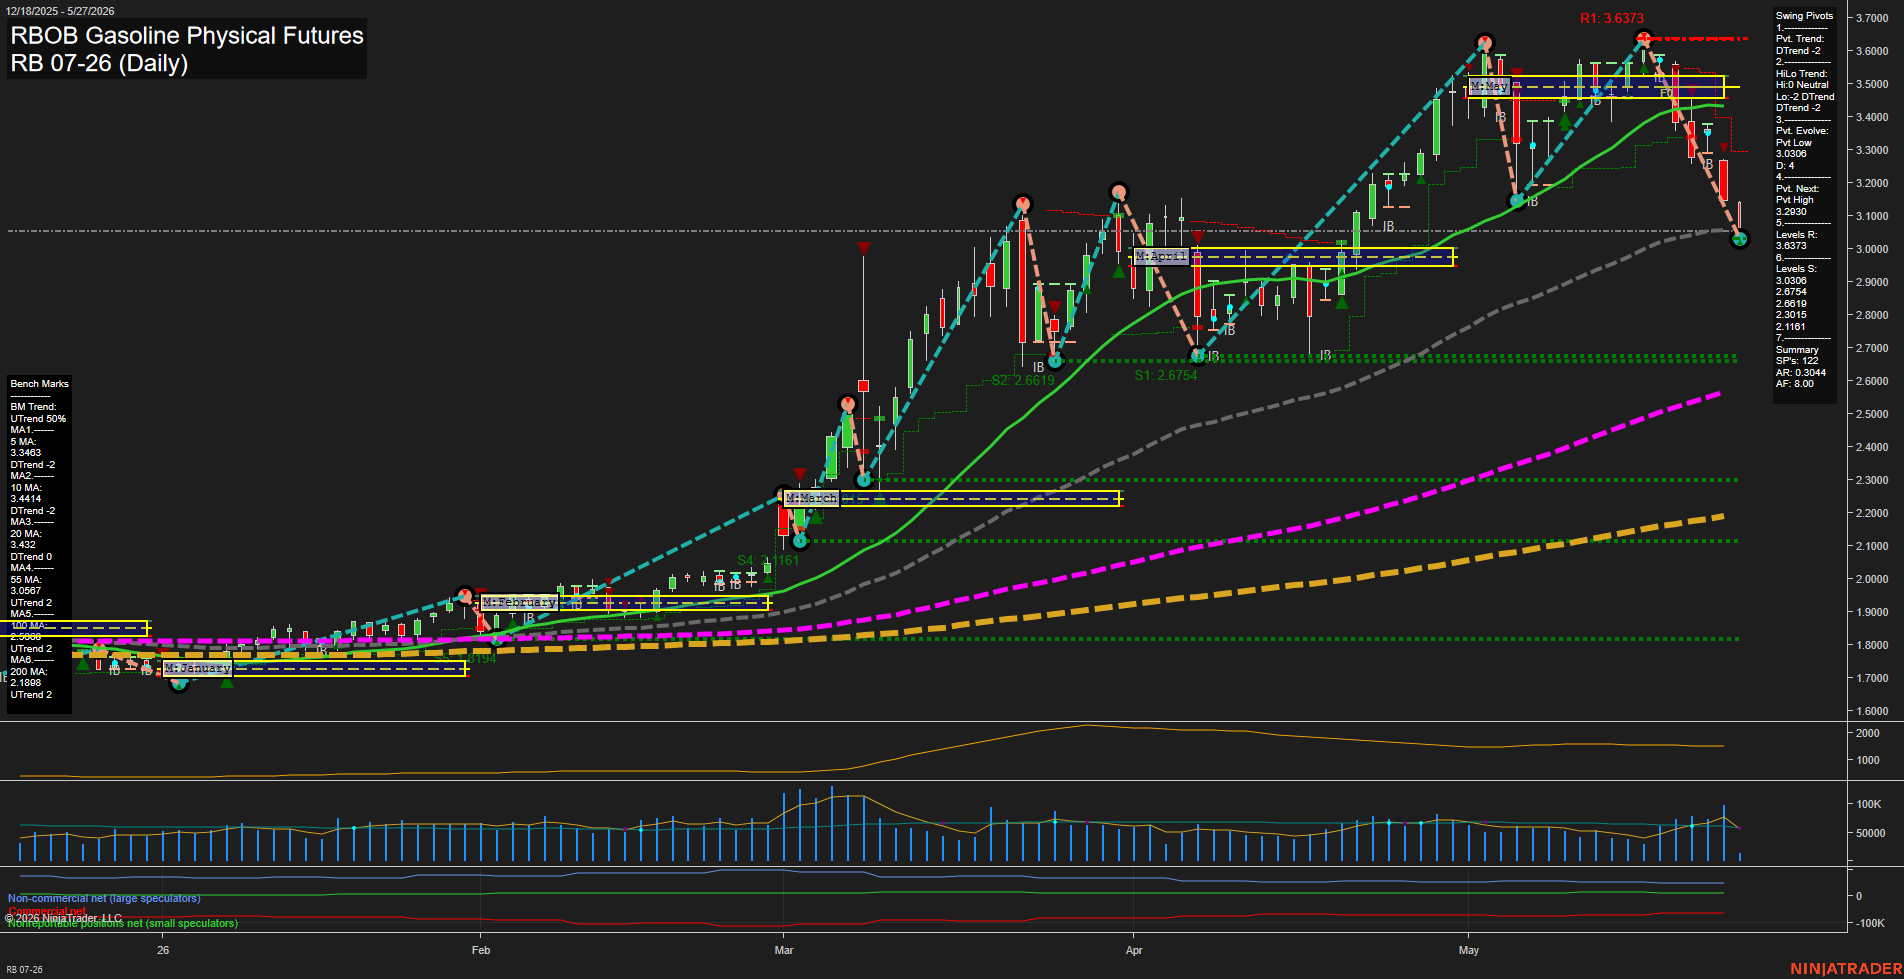
RB RBOB Gasoline Physical Futures Daily Chart Analysis: 2026-May-27 07:05 CT
Price Action
- Last: 3.0306,
- Bars: Large,
- Mom: Fast.
WSFG Weekly
- Short-Term
- WSFG Current: -61%
- F0%/NTZ' Bias: Price Below,
- WSFG Trend: Down.
MSFG Month May
- Intermediate-Term
- MSFG Current: -77%
- F0%/NTZ' Bias: Price Below,
- MSFG Trend: Down.
YSFG Year 2026
- Long-Term
- YSFG Current: 132%
- F0%/NTZ' Bias: Price Above,
- YSFG Trend: Up.
Swing Pivots
- (Short-Term) 1. Pvt. Trend: DTrend -2,
- (Intermediate-Term) 2. HiLo Trend: Hi:0 Neutral Lo:-2 DTrend -2,
- 3. Pvt. Evolve: Pvt Low 3.0306,
- 4. Pvt. Next: Pvt High 3.2930,
- 5. Levels R: 3.6373,
- 6. Levels S: 3.0306, 2.6754, 2.6619, 2.3015, 2.1161.
Daily Benchmarks
- (Short-Term) 5 Day: 3.3463 Down Trend,
- (Short-Term) 10 Day: 3.4414 Down Trend,
- (Intermediate-Term) 20 Day: 3.4320 Down Trend,
- (Intermediate-Term) 55 Day: 3.0567 Up Trend,
- (Long-Term) 100 Day: 2.9040 Up Trend,
- (Long-Term) 200 Day: 2.1898 Up Trend.
Additional Metrics
Recent Trade Signals
- 26 May 2026: Short RB 07-26 @ 3.2057 Signals.USAR-WSFG
- 21 May 2026: Short RB 07-26 @ 3.388 Signals.USAR-MSFG
- 20 May 2026: Short RB 07-26 @ 3.4274 Signals.USAR.TR120
Overall Rating
- Short-Term: Bearish,
- Intermediate-Term: Bearish,
- Long-Term: Bullish.
Key Insights Summary
Price has rolled over sharply from the early-May peak near the 3.63 area and is now trading back down through the 3.03 pivot support, with fast downside momentum and large daily bars confirming a strong short-term selloff. Weekly and monthly session fib grids remain below their F0%/NTZ centers, keeping the short and intermediate structure bearish, while the long-term year grid still sits above its center and preserves a broader bullish backdrop. The swing pivot structure has shifted to DTrend, with nearby resistance marked at 3.2930 and higher resistance at 3.6373, while support has been broken at 3.0306 and the next lower reference levels sit at 2.6754, 2.6619, 2.3015, and 2.1161. Daily benchmarks show the front end of the curve under pressure, but the 55-, 100-, and 200-day averages remain in up-trend alignment, pointing to a larger uptrend that is currently experiencing a deep corrective phase and volatile retracement.
Chart Analysis ATS AI Generated: 2026-05-27 07:06 for Informational use only, not trading advice. Terms and Risk Disclosure Copyright © 2026. Algo Trading Systems LLC.