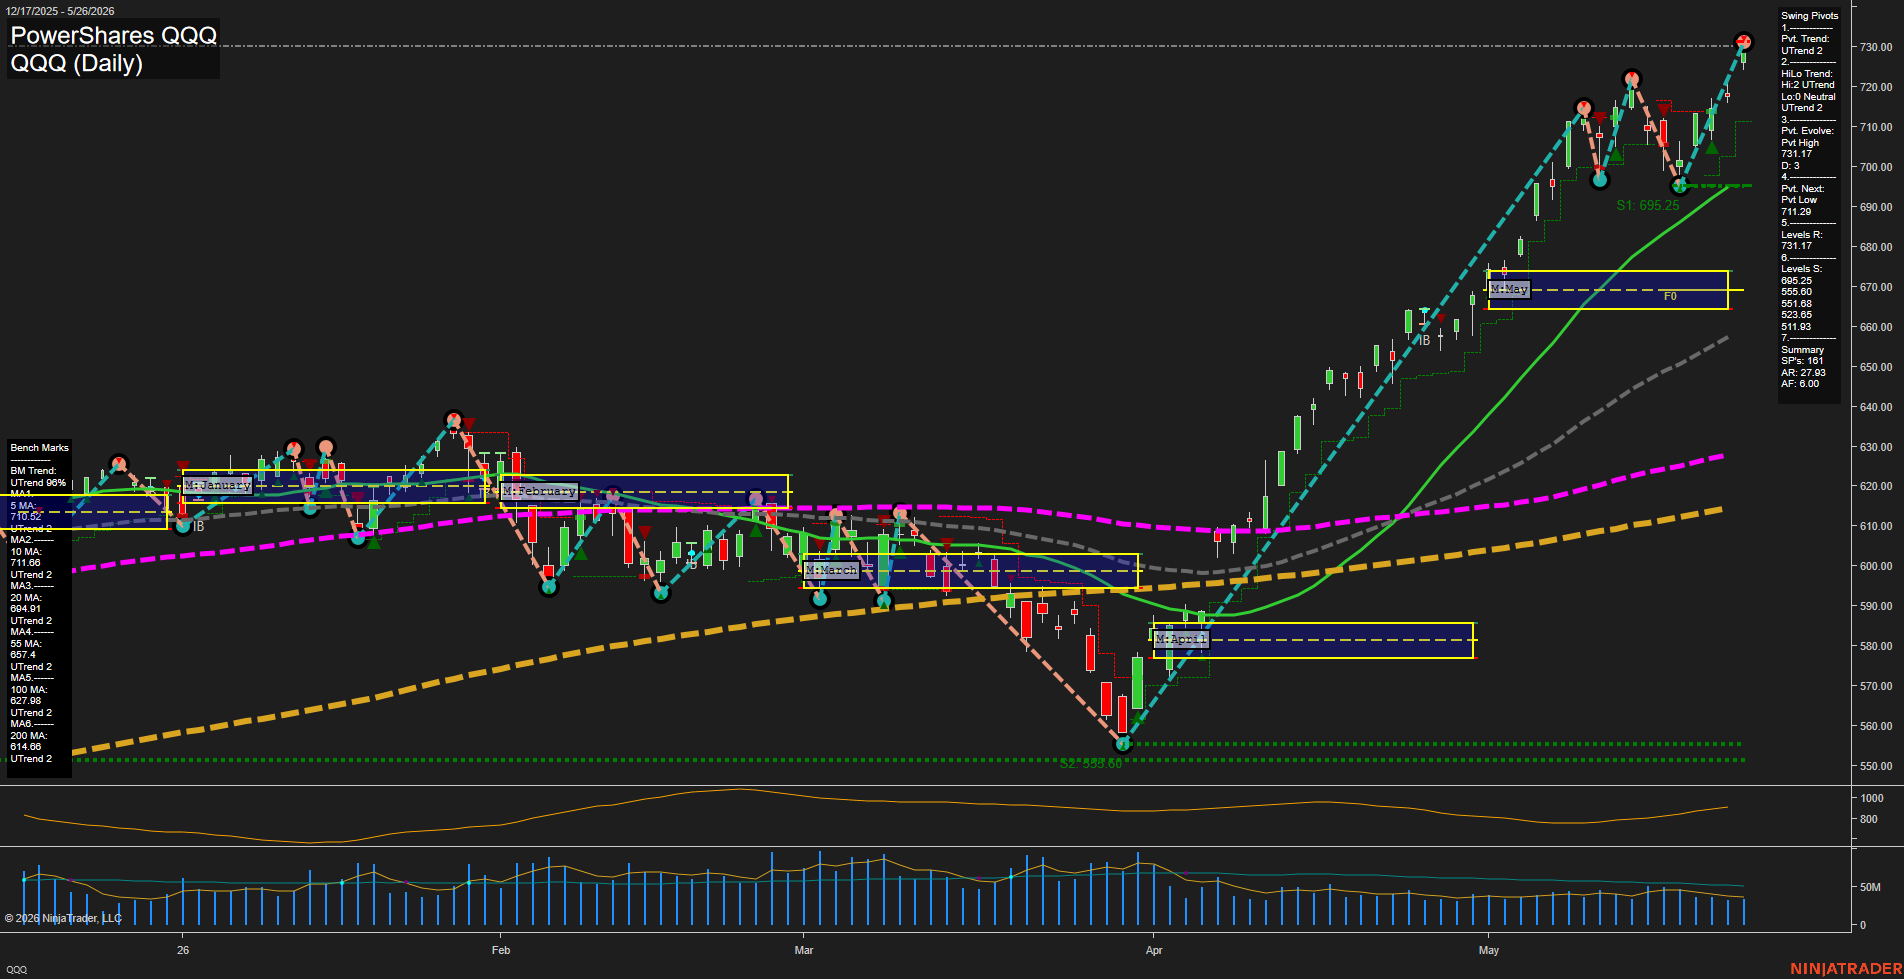
QQQ PowerShares QQQ Daily Chart Analysis: 2026-May-27 07:05 CT
Price Action
- Last: 731.17,
- Bars: Large,
- Mom: fast.
WSFG Weekly
- Short-Term
- WSFG Current: NA%
- F0%/NTZ' Bias: Price Neutral,
- WSFG Trend: Neutral.
MSFG Month May
- Intermediate-Term
- MSFG Current: NA%
- F0%/NTZ' Bias: Price Neutral,
- MSFG Trend: Neutral.
YSFG Year 2026
- Long-Term
- YSFG Current: NA%
- F0%/NTZ' Bias: Price Neutral,
- YSFG Trend: Neutral.
Swing Pivots
- (Short-Term) 1. Pvt. Trend: UTrend,
- (Intermediate-Term) 2. HiLo Trend: UTrend,
- 3. Pvt. Evolve: Pvt High 731.17,
- 4. Pvt. Next: Pvt Low 711.29,
- 5. Levels R: 731.17,
- 6. Levels S: 695.25, 555.60, 551.68, 523.65, 511.93.
Daily Benchmarks
- (Short-Term) 5 Day: 710.52 Up Trend,
- (Short-Term) 10 Day: 711.66 Up Trend,
- (Intermediate-Term) 20 Day: 694.91 Up Trend,
- (Intermediate-Term) 55 Day: 657.40 Up Trend,
- (Long-Term) 100 Day: 627.98 Up Trend,
- (Long-Term) 200 Day: 614.66 Up Trend.
Additional Metrics
- ATR: 733,
- VOLMA: 32709273.
Overall Rating
- Short-Term: Bullish,
- Intermediate-Term: Bullish,
- Long-Term: Bullish.
Key Insights Summary
QQQ is in a strong directional advance with a fast momentum profile and large daily bars pressing into fresh highs near 731.17. The pivot structure remains firmly UTrend on both the short-term pivot read and the hi/lo sequence, while price is trading well above all benchmark moving averages, which are stacked positively from the 5-day through the 200-day line. The chart shows a powerful rally leg from the April low followed by a steep continuation into late May, with the current price action holding near the upper range after an extended expansion phase. The monthly fib grid area is still being traversed in an active trend regime, and the broader structure reflects higher highs, higher lows, and sustained upside leadership across short, intermediate, and long horizons.
Chart Analysis ATS AI Generated: 2026-05-27 07:05 for Informational use only, not trading advice. Terms and Risk Disclosure Copyright © 2026. Algo Trading Systems LLC.