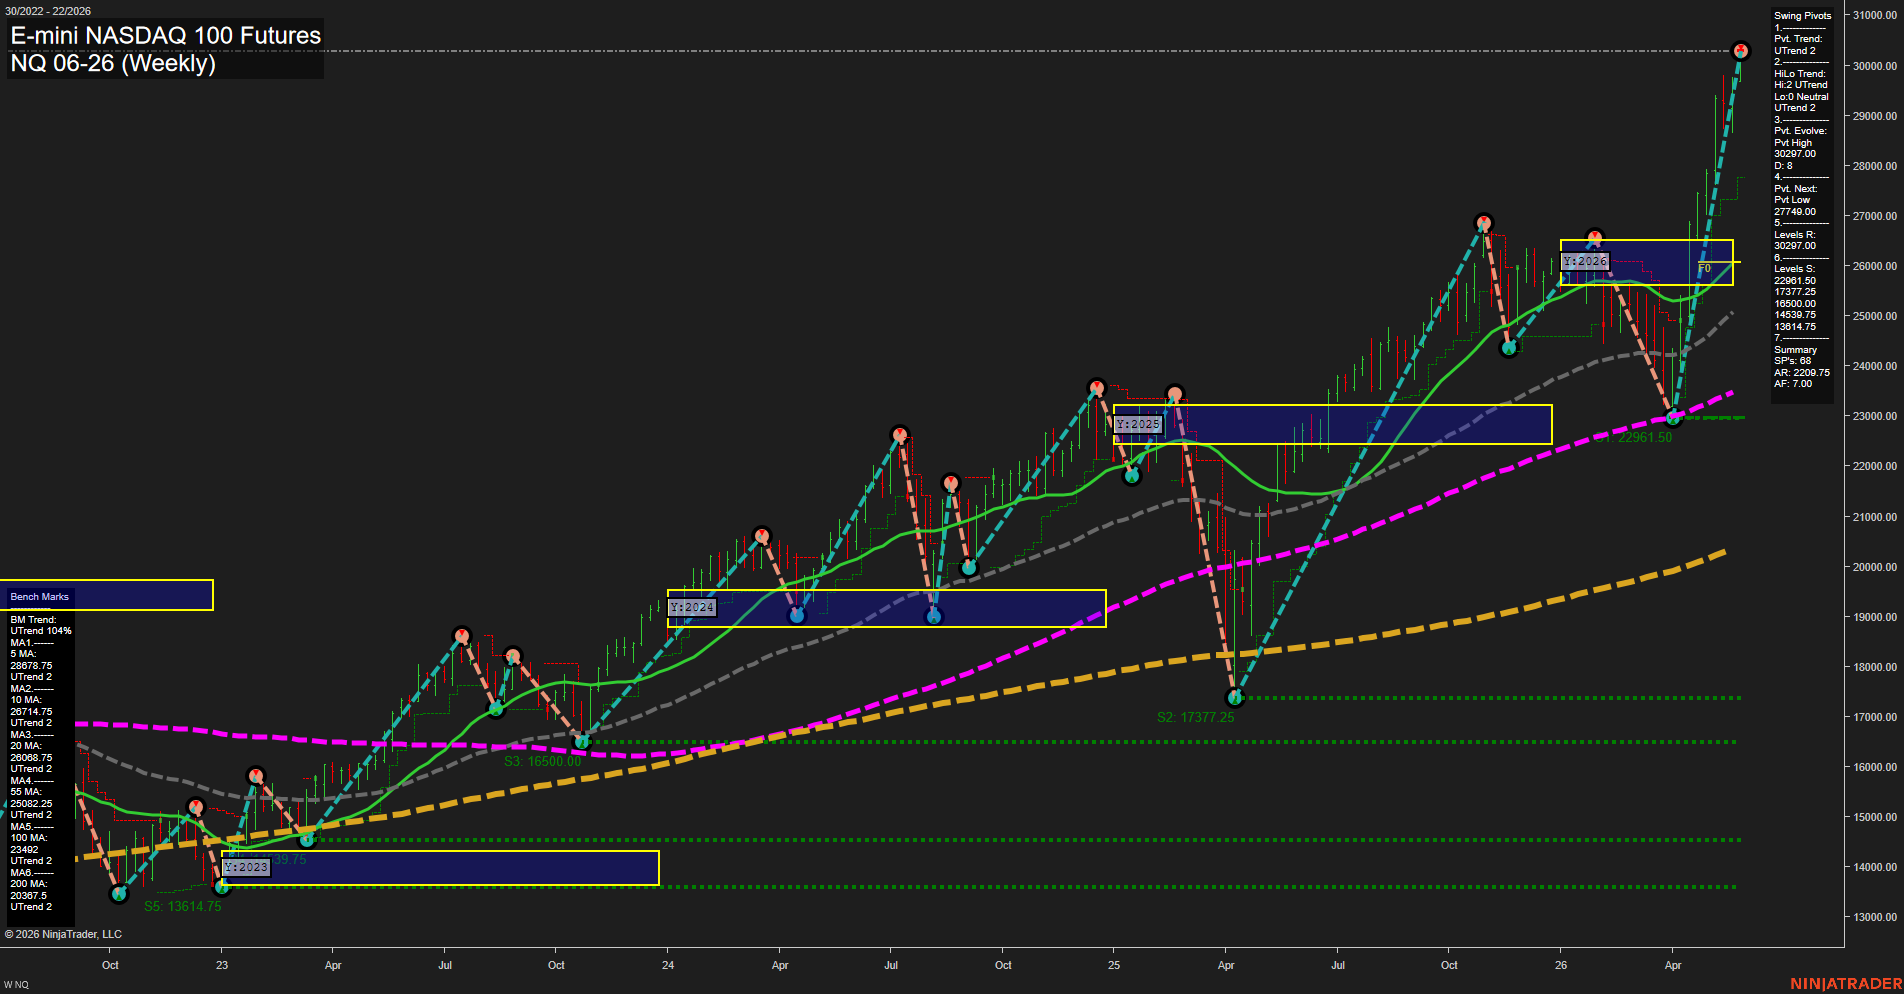
NQ E-mini NASDAQ 100 Futures Weekly Chart Analysis: 2026-May-27 07:05 CT
Price Action
- Last: 30200,
- Bars: Large,
- Mom: fast.
WSFG Weekly
- Short-Term
- WSFG Current: 49%
- F0%/NTZ' Bias: Price Above,
- WSFG Trend: Up.
MSFG Month May
- Intermediate-Term
- MSFG Current: 115%
- F0%/NTZ' Bias: Price Above,
- MSFG Trend: Up.
YSFG Year 2026
- Long-Term
- YSFG Current: 95%
- F0%/NTZ' Bias: Price Above,
- YSFG Trend: Up.
Swing Pivots
- (Short-Term) 1. Pvt. Trend: UTrend,
- (Intermediate-Term) 2. HiLo Trend: UTrend,
- 3. Pvt. Evolve: Pvt High 30297.00,
- 4. Pvt. Next: Pvt Low 27749.00,
- 5. Levels R: 30297.00,
- 6. Levels S: 22961.50, 17377.25, 16500.00, 14539.75, 13614.75.
Weekly Benchmarks
- (Short-Term) 5 Day: 28678.75 Up Trend,
- (Short-Term) 10 Day: 28714.75 Up Trend,
- (Intermediate-Term) 20 Day: 28068.75 Up Trend,
- (Intermediate-Term) 55 Day: 25082.25 Up Trend,
- (Long-Term) 100 Day: 23492.00 Up Trend,
- (Long-Term) 200 Day: 20367.50 Up Trend.
Recent Trade Signals
- 26 May 2026: Long NQ 06-26 @ 29825.25 Signals.USAR-WSFG
- 20 May 2026: Long NQ 06-26 @ 29396.25 Signals.USAR.TR120
Overall Rating
- Short-Term: Bullish,
- Intermediate-Term: Bullish,
- Long-Term: Bullish.
Key Insights Summary
The weekly structure remains firmly trend-positive, with price trading well above all benchmark moving averages and pushing into fresh highs near 30,200 after a sharp V-shaped recovery from the 2026 spring pullback. The short-term pivot trend is still UTrend, and the intermediate HiLo pivot trend is also UTrend, confirming that both swing rhythm and broader market structure remain aligned to the upside. Weekly and monthly fib grid readings stay above F0%, which supports continuation strength rather than range failure. The active pivot map shows a new pivot high at 30,297 with the next opposite pivot low reference at 27,749, while the higher-timeframe support shelves remain much lower at 22,961.50 and beneath, reflecting a powerful upward re-pricing cycle. Recent long signals on 20 May and 26 May reinforce that the current swing phase has been tracked as an upside continuation move, with momentum expanding rather than compressing.
Chart Analysis ATS AI Generated: 2026-05-27 07:05 for Informational use only, not trading advice. Terms and Risk Disclosure Copyright © 2026. Algo Trading Systems LLC.