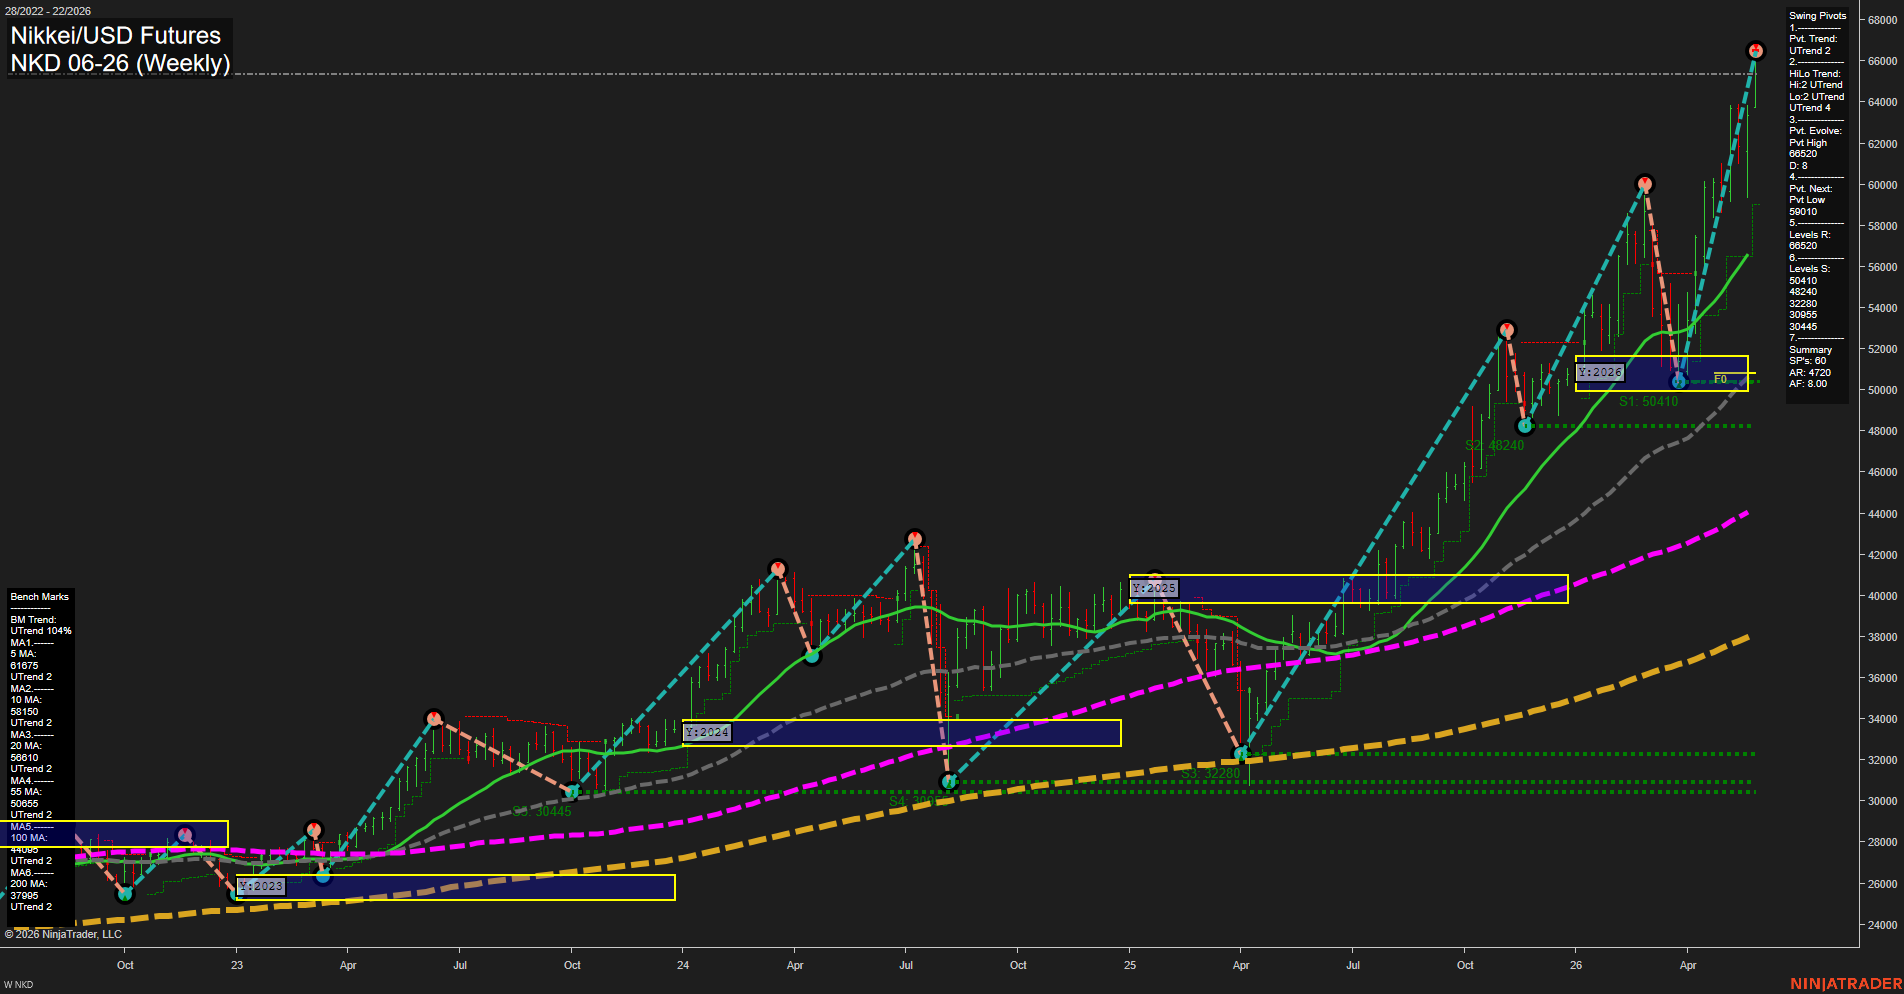
NKD Nikkei/USD Futures Weekly Chart Analysis: 2026-May-27 07:05 CT
Price Action
- Last: 66520,
- Bars: Large,
- Mom: Fast.
WSFG Weekly
- Short-Term
- WSFG Current: 44%
- F0%/NTZ' Bias: Price Above,
- WSFG Trend: Up.
MSFG Month May
- Intermediate-Term
- MSFG Current: 86%
- F0%/NTZ' Bias: Price Above,
- MSFG Trend: Up.
YSFG Year 2026
- Long-Term
- YSFG Current: 171%
- F0%/NTZ' Bias: Price Above,
- YSFG Trend: Up.
Swing Pivots
- (Short-Term) 1. Pvt. Trend: UTrend,
- (Intermediate-Term) 2. HiLo Trend: UTrend,
- 3. Pvt. Evolve: Pvt High 66520,
- 4. Pvt. Next: Pvt Low 59010,
- 5. Levels R: 66520,
- 6. Levels S: 50410, 48240, 32280, 30955, 30445.
Weekly Benchmarks
- (Short-Term) 5 Day: 61675 Up Trend,
- (Short-Term) 10 Day: 58150 Up Trend,
- (Intermediate-Term) 20 Day: 56810 Up Trend,
- (Intermediate-Term) 55 Day: 50655 Up Trend,
- (Long-Term) 100 Day: 44085 Up Trend,
- (Long-Term) 200 Day: 37895 Up Trend.
Recent Trade Signals
- 21 May 2026: Long NKD 06-26 @ 62255 Signals.USAR-WSFG
- 20 May 2026: Long NKD 06-26 @ 61350 Signals.USAR.TR120
- 20 May 2026: Long NKD 06-26 @ 61200 Signals.USAR-MSFG
Overall Rating
- Short-Term: Bullish,
- Intermediate-Term: Bullish,
- Long-Term: Bullish.
Key Insights Summary
NKD is in a strong weekly uptrend with price pressing to fresh highs near 66520 and expanding momentum. The weekly, monthly, and yearly session fib grids are all aligned above F0%/NTZ with bullish trend readings, confirming broad multi-timeframe strength. Swing pivots remain firmly UTrend, and the benchmark stack is fully positive with every moving average rising in bullish order beneath price. The recent sequence shows a strong impulse leg followed by continuation back to new highs, indicating trend extension rather than consolidation. The chart reflects a powerful rally structure with higher highs and higher lows, and the current weekly bar size and fast momentum reinforce an active breakout phase.
Chart Analysis ATS AI Generated: 2026-05-27 07:05 for Informational use only, not trading advice. Terms and Risk Disclosure Copyright © 2026. Algo Trading Systems LLC.