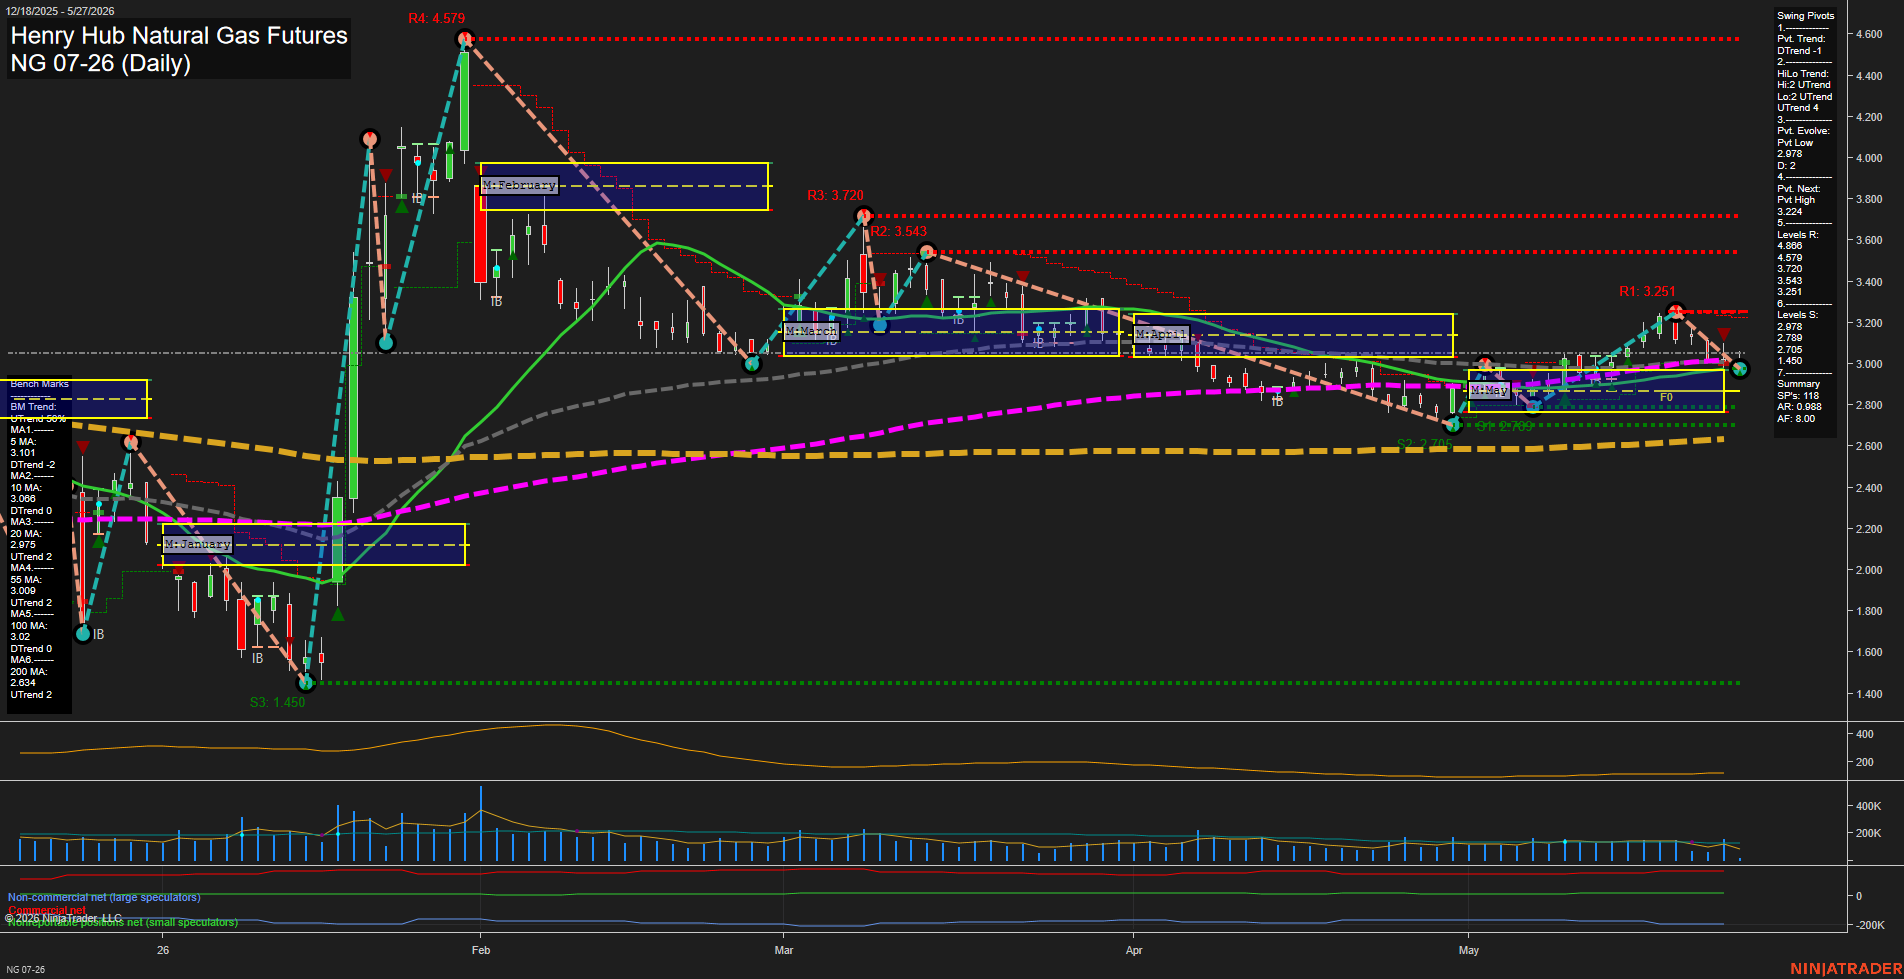
NG Henry Hub Natural Gas Futures Daily Chart Analysis: 2026-May-27 07:04 CT
Price Action
- Last: 2.988,
- Bars: Small,
- Mom: Slow.
WSFG Weekly
- Short-Term
- WSFG Current: 21%
- F0%/NTZ' Bias: Price Above,
- WSFG Trend: Up.
MSFG Month May
- Intermediate-Term
- MSFG Current: 24%
- F0%/NTZ' Bias: Price Above,
- MSFG Trend: Up.
YSFG Year 2026
- Long-Term
- YSFG Current: 24%
- F0%/NTZ' Bias: Price Above,
- YSFG Trend: Up.
Swing Pivots
- (Short-Term) 1. Pvt. Trend: DTrend,
- (Intermediate-Term) 2. HiLo Trend: UTrend,
- 3. Pvt. Evolve: Pvt Low 2.978,
- 4. Pvt. Next: Pvt High 3.224,
- 5. Levels R: 4.866, 4.579, 3.720, 3.543, 3.251,
- 6. Levels S: 2.978, 2.789, 2.705, 1.450.
Daily Benchmarks
- (Short-Term) 5 Day: 3.101 Down Trend,
- (Short-Term) 10 Day: 3.066 Down Trend,
- (Intermediate-Term) 20 Day: 2.975 Up Trend,
- (Intermediate-Term) 55 Day: 3.009 Up Trend,
- (Long-Term) 100 Day: 3.020 Down Trend,
- (Long-Term) 200 Day: 2.634 Up Trend.
Additional Metrics
Recent Trade Signals
- 27 May 2026: Long NG 07-26 @ 3.063 Signals.USAR-WSFG
- 26 May 2026: Long NG 07-26 @ 3.096 Signals.USAR.TR120
Overall Rating
- Short-Term: Bearish,
- Intermediate-Term: Neutral,
- Long-Term: Bullish.
Key Insights Summary
Natural gas is trading just under 3.00 after a multi-month recovery from the February washout, with the daily structure still showing a short-term pivot downtrend while the higher pivot framework remains constructive. Price is holding above the weekly, monthly, and yearly session Fib equilibrium zones, which keeps the broader session bias positive even as the last several daily bars have compressed and momentum has slowed. The nearby 2.978 swing low is the immediate support pivot, while 3.224 is the next upside pivot reference; overhead resistance remains layered at 3.251, 3.543, 3.720, and the major 4.579 to 4.866 zone. Benchmark alignment is mixed in the near term, with the 5-day and 10-day averages still below price action in a weakening posture, while the 20-day, 55-day, and 200-day structure stays more supportive than the 100-day. The tape looks like a consolidation phase after the late-May push, with smaller candles and lower volatility tone compared with the earlier swing expansion, leaving the market in a pause-and-balance condition rather than a trending impulse.
Chart Analysis ATS AI Generated: 2026-05-27 07:04 for Informational use only, not trading advice. Terms and Risk Disclosure Copyright © 2026. Algo Trading Systems LLC.