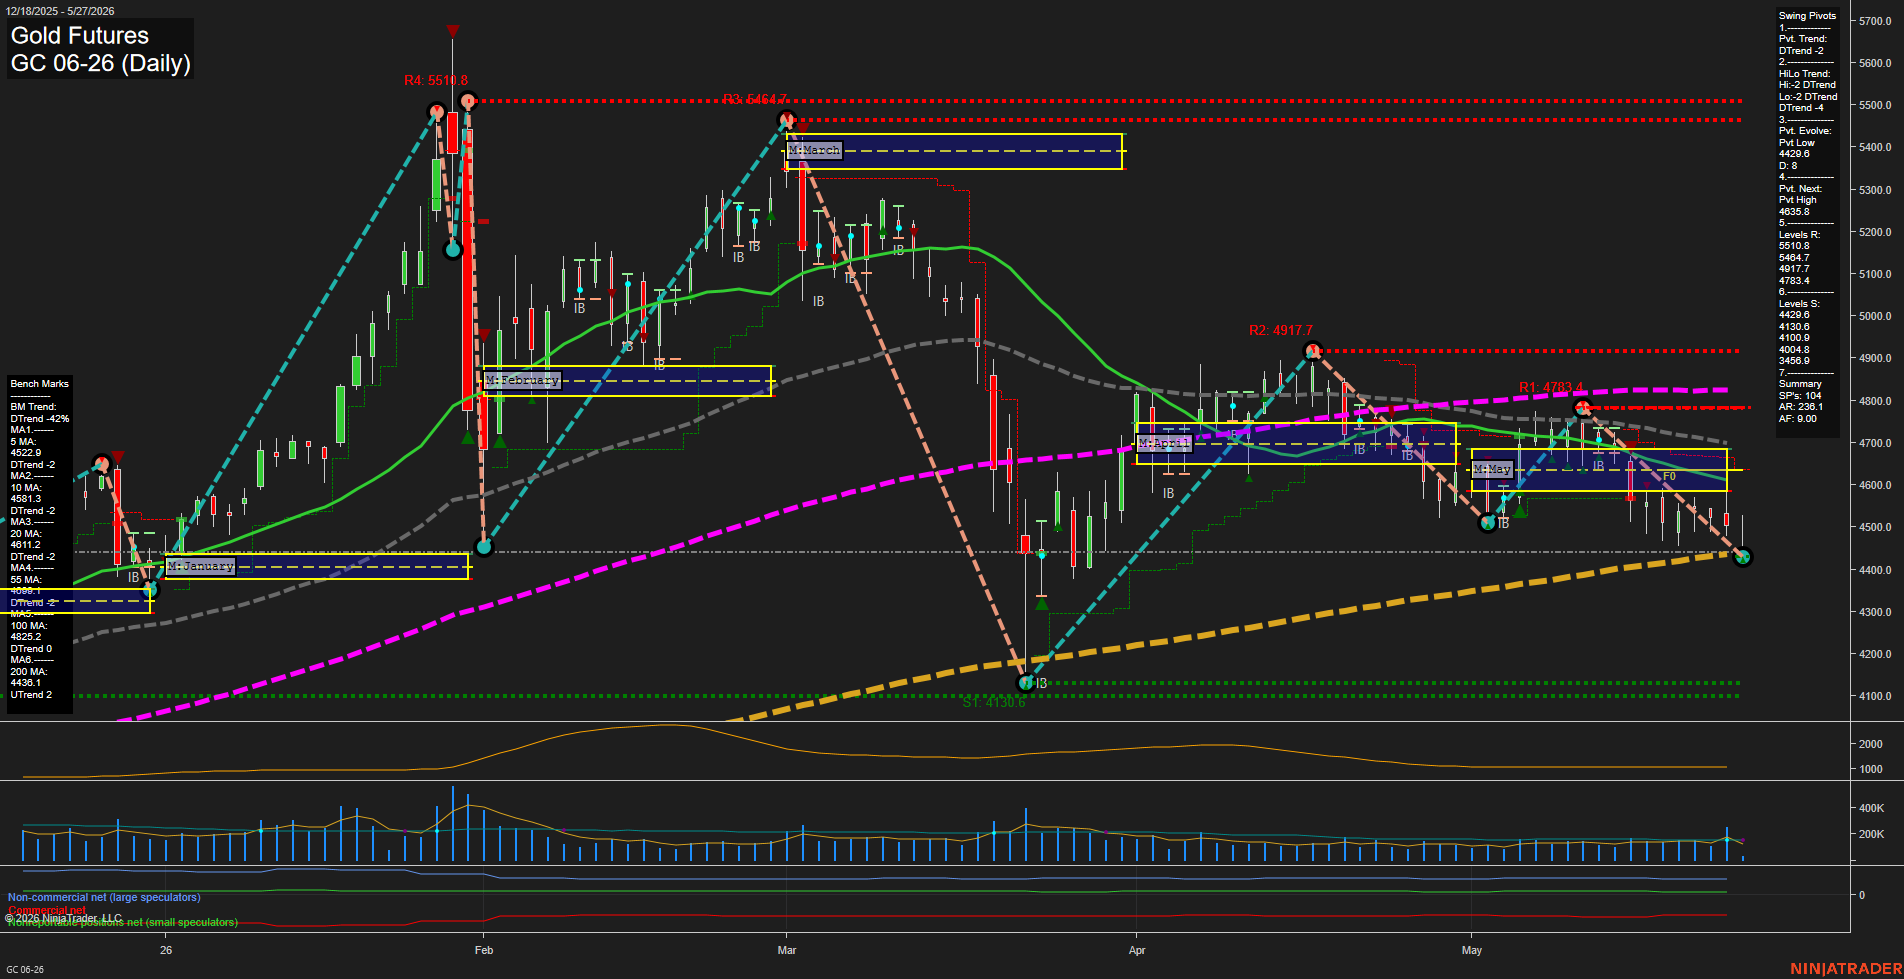
GC Gold Futures Daily Chart Analysis: 2026-May-27 07:03 CT
Price Action
- Last: 4445.0,
- Bars: Large,
- Mom: fast.
WSFG Weekly
- Short-Term
- WSFG Current: -47%
- F0%/NTZ' Bias: Price Below,
- WSFG Trend: Down.
MSFG Month May
- Intermediate-Term
- MSFG Current: -24%
- F0%/NTZ' Bias: Price Below,
- MSFG Trend: Down.
YSFG Year 2026
- Long-Term
- YSFG Current: -40%
- F0%/NTZ' Bias: Price Below,
- YSFG Trend: Down.
Swing Pivots
- (Short-Term) 1. Pvt. Trend: DTrend,
- (Intermediate-Term) 2. HiLo Trend: DTrend,
- 3. Pvt. Evolve: Pvt Low 4429.6,
- 4. Pvt. Next: Pvt High 4685.8,
- 5. Levels R: 5510.8, 5464.7, 4917.7, 4783.4,
- 6. Levels S: 4429.6, 4130.6, 4100.9, 4004.8, 3456.9.
Daily Benchmarks
- (Short-Term) 5 Day: 4522.9 Down Trend,
- (Short-Term) 10 Day: 4581.3 Down Trend,
- (Intermediate-Term) 20 Day: 4611.2 Down Trend,
- (Intermediate-Term) 55 Day: 4505.0 Down Trend,
- (Long-Term) 100 Day: 4825.2 Down Trend,
- (Long-Term) 200 Day: 4436.1 Up Trend.
Additional Metrics
- ATR: 236.1,
- VOLMA: 182966.
Recent Trade Signals
- 27 May 2026: Short GC 06-26 @ 4480.1 Signals.USAR-MSFG
- 27 May 2026: Short GC 06-26 @ 4496.4 Signals.USAR-WSFG
- 26 May 2026: Short GC 06-26 @ 4515.1 Signals.USAR.TR120
Overall Rating
- Short-Term: Bearish,
- Intermediate-Term: Bearish,
- Long-Term: Bearish.
Key Insights Summary
Gold futures are in a broad daily down phase with price pressing below the weekly, monthly, and yearly F0%/NTZ centers, confirming persistent weakness across multiple swing horizons. The current bar structure shows expanding downside momentum, with price trading under the 5, 10, 20, and 55-day benchmarks and failing to reclaim the 4500-4600 area that now acts as overhead supply. Swing pivot structure remains in DTrend, and the most recent pivot sequence continues to define lower highs and lower lows, with 4429.6 standing as the active pivot low and 4685.8 as the next opposing pivot high. The recent signal cluster is aligned with downside continuation, while the only notable longer-term counterweight is the 200-day benchmark sitting near the current market, reflecting a mixed but still pressure-heavy backdrop.
Chart Analysis ATS AI Generated: 2026-05-27 07:03 for Informational use only, not trading advice. Terms and Risk Disclosure Copyright © 2026. Algo Trading Systems LLC.