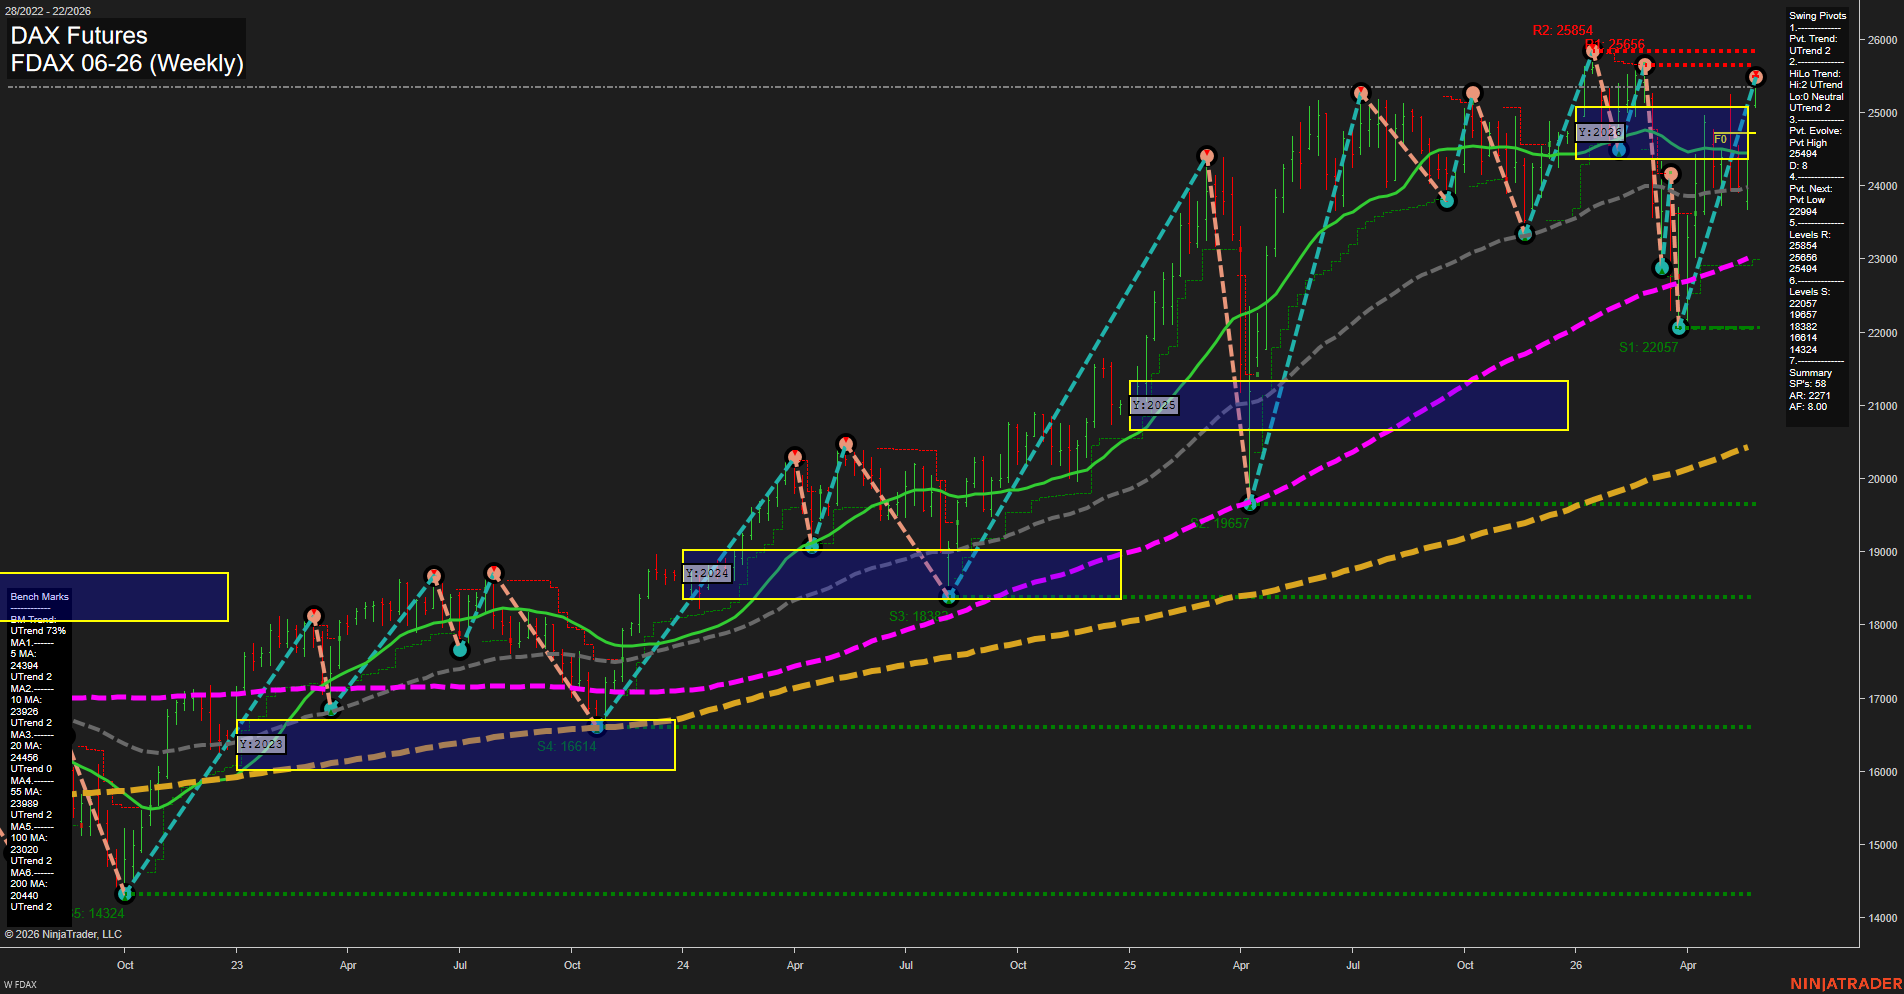
FDAX DAX Futures Weekly Chart Analysis: 2026-May-27 07:03 CT
Price Action
- Last: 25494,
- Bars: Large,
- Mom: fast.
WSFG Weekly
- Short-Term
- WSFG Current: 21%
- F0%/NTZ' Bias: Price Above,
- WSFG Trend: Up.
MSFG Month May
- Intermediate-Term
- MSFG Current: 44%
- F0%/NTZ' Bias: Price Above,
- MSFG Trend: Up.
YSFG Year 2026
- Long-Term
- YSFG Current: 16%
- F0%/NTZ' Bias: Price Above,
- YSFG Trend: Up.
Swing Pivots
- (Short-Term) 1. Pvt. Trend: UTrend,
- (Intermediate-Term) 2. HiLo Trend: UTrend,
- 3. Pvt. Evolve: Pvt High 25494,
- 4. Pvt. Next: Pvt Low 22994,
- 5. Levels R: 25854, 25656, 25494,
- 6. Levels S: 22057, 19857, 18382, 16614, 14324.
Weekly Benchmarks
- (Short-Term) 5 Day: 24394 Up Trend,
- (Short-Term) 10 Day: 23926 Up Trend,
- (Intermediate-Term) 20 Day: 24456 Up Trend,
- (Intermediate-Term) 55 Day: 23898 Up Trend,
- (Long-Term) 100 Day: 23020 Up Trend,
- (Long-Term) 200 Day: 20440 Up Trend.
Recent Trade Signals
- 25 May 2026: Long FDAX 06-26 @ 25226 Signals.USAR-WSFG
- 22 May 2026: Long FDAX 06-26 @ 24823 Signals.USAR-MSFG
Overall Rating
- Short-Term: Bullish,
- Intermediate-Term: Bullish,
- Long-Term: Bullish.
Key Insights Summary
The weekly structure remains firmly aligned to the upside, with price holding above the key session fib midpoints and all benchmark moving averages stacked in bullish order. The swing pivot sequence shows a continuing higher-high / higher-low pattern, with the latest push into the 25494 area confirming renewed upward momentum after the sharp recovery from the 22994 pivot low. Resistance is layered overhead into 25656 and 25854, while support is well defined beneath the market from 25494 down through 22057 and the deeper long-cycle levels. The recent long signals from WSFG and MSFG match the broader trend profile, and the chart continues to reflect a strong trending phase rather than a corrective or range-bound structure.
Chart Analysis ATS AI Generated: 2026-05-27 07:03 for Informational use only, not trading advice. Terms and Risk Disclosure Copyright © 2026. Algo Trading Systems LLC.