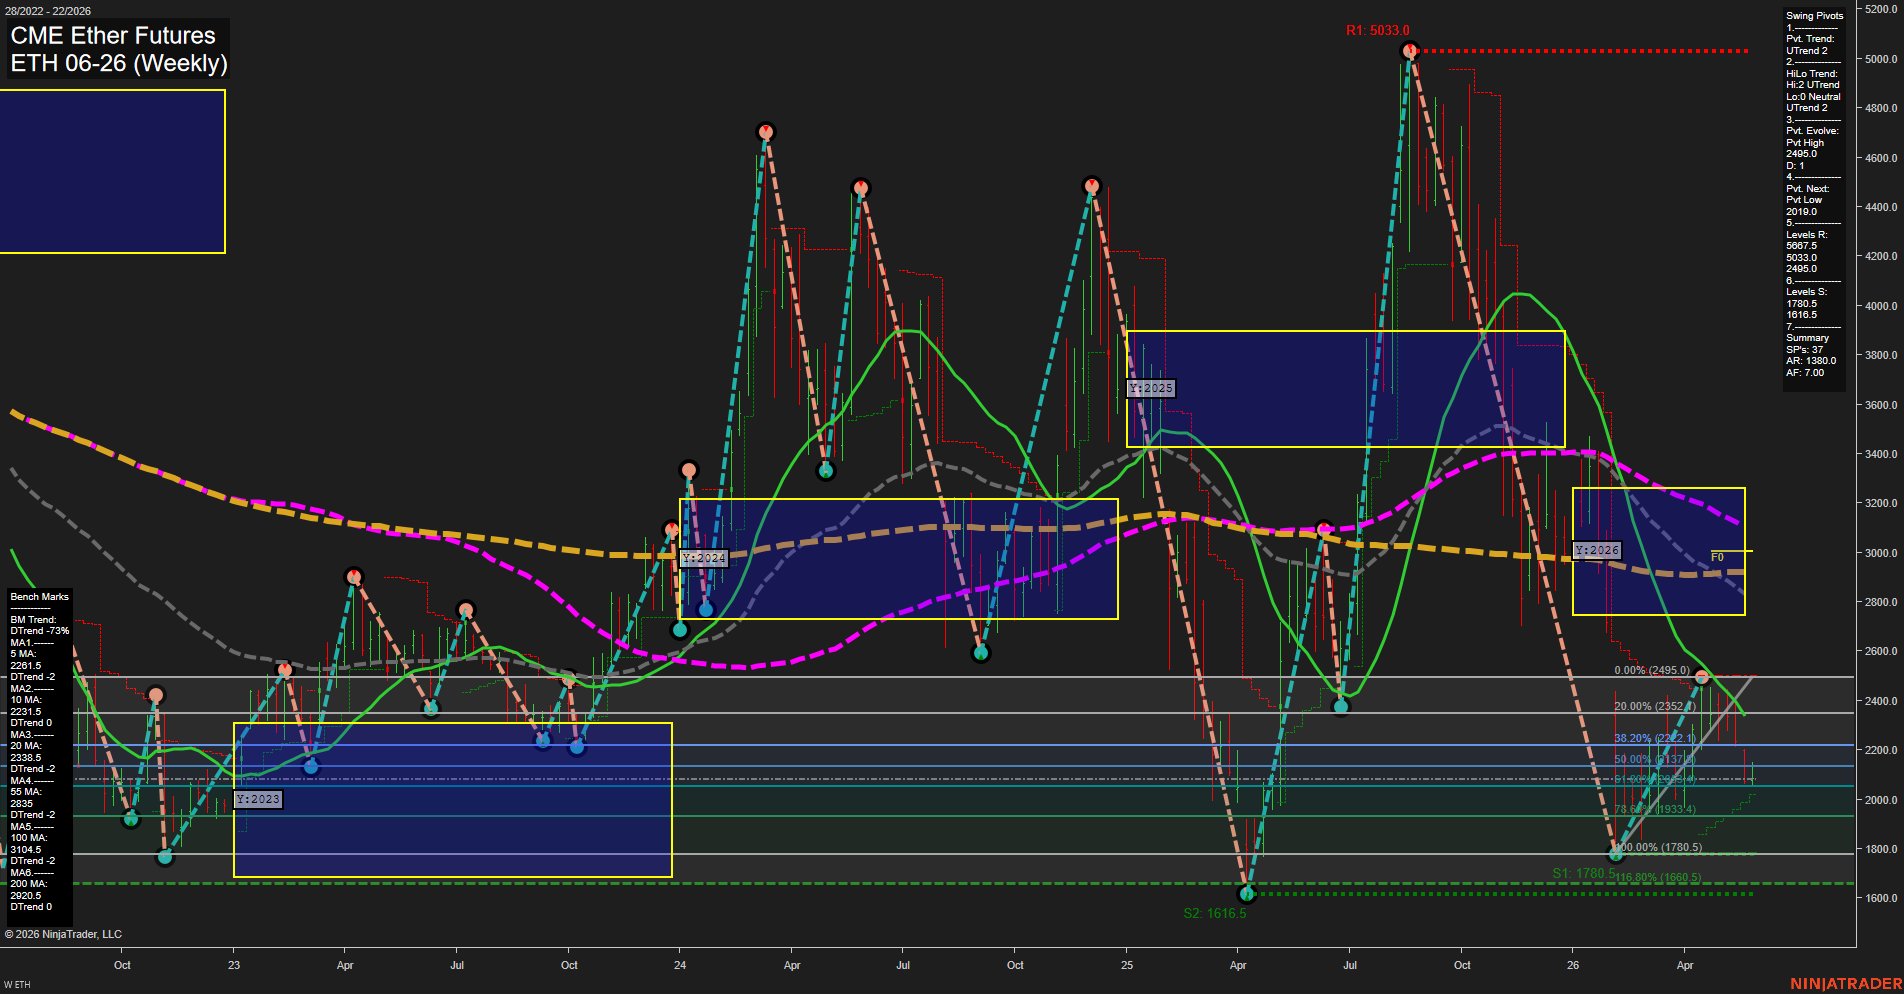
ETH CME Ether Futures Weekly Chart Analysis: 2026-May-27 07:03 CT
Price Action
- Last: 2470.0,
- Bars: Large,
- Mom: fast.
WSFG Weekly
- Short-Term
- WSFG Current: 5%
- F0%/NTZ' Bias: Price Above,
- WSFG Trend: Up.
MSFG Month May
- Intermediate-Term
- MSFG Current: -44%
- F0%/NTZ' Bias: Price Below,
- MSFG Trend: Down.
YSFG Year 2026
- Long-Term
- YSFG Current: -36%
- F0%/NTZ' Bias: Price Below,
- YSFG Trend: Down.
Swing Pivots
- (Short-Term) 1. Pvt. Trend: UTrend,
- (Intermediate-Term) 2. HiLo Trend: UTrend,
- 3. Pvt. Evolve: Pvt High 2495.0,
- 4. Pvt. Next: Pvt Low 2019.0,
- 5. Levels R: 5687.5, 5033.0, 2495.0,
- 6. Levels S: 1780.5, 1616.5.
Weekly Benchmarks
- (Short-Term) 5 Day: 2261.5 Down Trend,
- (Short-Term) 10 Day: 2231.5 Down Trend,
- (Intermediate-Term) 20 Day: 2338.5 Down Trend,
- (Intermediate-Term) 55 Day: 2835.0 Down Trend,
- (Long-Term) 100 Day: 3104.5 Down Trend,
- (Long-Term) 200 Day: 2920.5 Down Trend.
Overall Rating
- Short-Term: Bullish,
- Intermediate-Term: Bearish,
- Long-Term: Bearish.
Key Insights Summary
Ethereum CME weekly structure is in a sharp recovery phase off the prior long decline, with price rebounding from the deep 2026 lower-zone test and pressing back toward the 0% yearly fib area near 2495. The weekly session grid remains supportive of near-term upside, while the monthly and yearly grids still sit below their midlines, keeping the broader backdrop under pressure. Swing pivots show an active UTrend and higher-lows recovery behavior, but the broader pivot map still caps price beneath the major 5033 and 5687.5 resistance tiers. Benchmarks remain stacked in a bearish long-term order, with price still below the 55-day, 100-day, and 200-day references, which frames the move as a countertrend weekly rally inside a larger corrective downtrend. The chart is showing a rebound/mean-reversion attempt with volatility compression after a large selloff, and the key technical theme is whether the current bounce can sustain above the yearly midpoint zone rather than fade back into the lower support band.
Chart Analysis ATS AI Generated: 2026-05-27 07:03 for Informational use only, not trading advice. Terms and Risk Disclosure Copyright © 2026. Algo Trading Systems LLC.