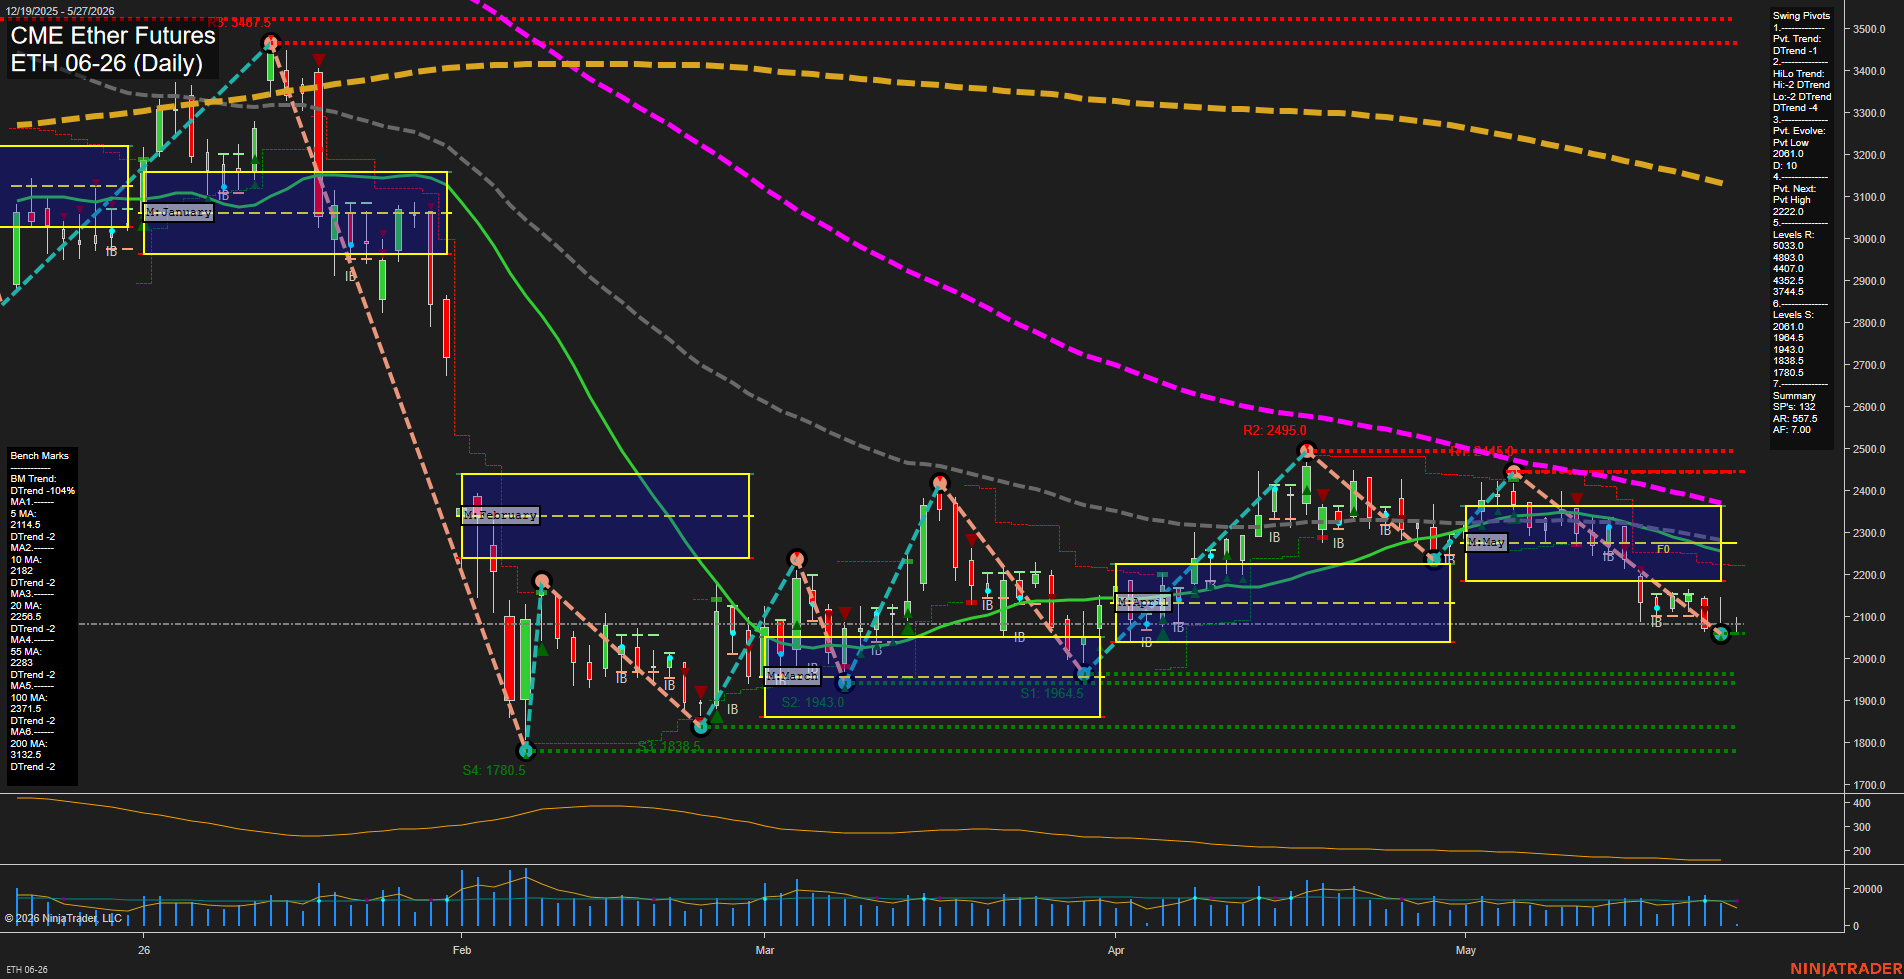
ETH CME Ether Futures Daily Chart Analysis: 2026-May-27 07:02 CT
Price Action
- Last: 2077.0,
- Bars: Small,
- Mom: slow.
WSFG Weekly
- Short-Term
- WSFG Current: 5%
- F0%/NTZ' Bias: Price Above,
- WSFG Trend: Up.
MSFG Month May
- Intermediate-Term
- MSFG Current: -44%
- F0%/NTZ' Bias: Price Below,
- MSFG Trend: Down.
YSFG Year 2026
- Long-Term
- YSFG Current: -36%
- F0%/NTZ' Bias: Price Below,
- YSFG Trend: Down.
Swing Pivots
- (Short-Term) 1. Pvt. Trend: DTrend,
- (Intermediate-Term) 2. HiLo Trend: DTrend,
- 3. Pvt. Evolve: Pvt Low 2081.0,
- 4. Pvt. Next: Pvt High 2222.0,
- 5. Levels R: 5033.0, 4893.0, 4407.0, 4352.5, 3744.5,
- 6. Levels S: 2061.0, 1964.5, 1943.0, 1838.5, 1780.5.
Daily Benchmarks
- (Short-Term) 5 Day: 2114.5 Down Trend,
- (Short-Term) 10 Day: 2182.0 Down Trend,
- (Intermediate-Term) 20 Day: 2256.5 Down Trend,
- (Intermediate-Term) 55 Day: 2283.0 Down Trend,
- (Long-Term) 100 Day: 2371.5 Down Trend,
- (Long-Term) 200 Day: 3132.5 Down Trend.
Additional Metrics
Overall Rating
- Short-Term: Bearish,
- Intermediate-Term: Bearish,
- Long-Term: Bearish.
Key Insights Summary
ETH CME Ether Futures is in a broad downtrend with price trading beneath all benchmark moving averages and below the monthly and yearly Fib NTZ centers, while the weekly structure remains the only constructive overlay. The daily swing pivot structure is still DTrend with HiLo Trend also down, and the most recent pivot sequence points to a lower-high failure after the 2222.0 swing high, followed by a drift back toward the 2061.0 and 1964.5 support band. Volatility remains elevated but easing, with recent candles compressing near the lower end of the May range after a multi-month selloff and a series of failed rebounds. The larger pattern is still defined by lower highs, lower lows, and repeated rejection beneath the 20/55/100 day benchmarks, keeping the intermediate and long-term tone aligned bearish despite the weekly session fib grid sitting above its centerline.
Chart Analysis ATS AI Generated: 2026-05-27 07:03 for Informational use only, not trading advice. Terms and Risk Disclosure Copyright © 2026. Algo Trading Systems LLC.