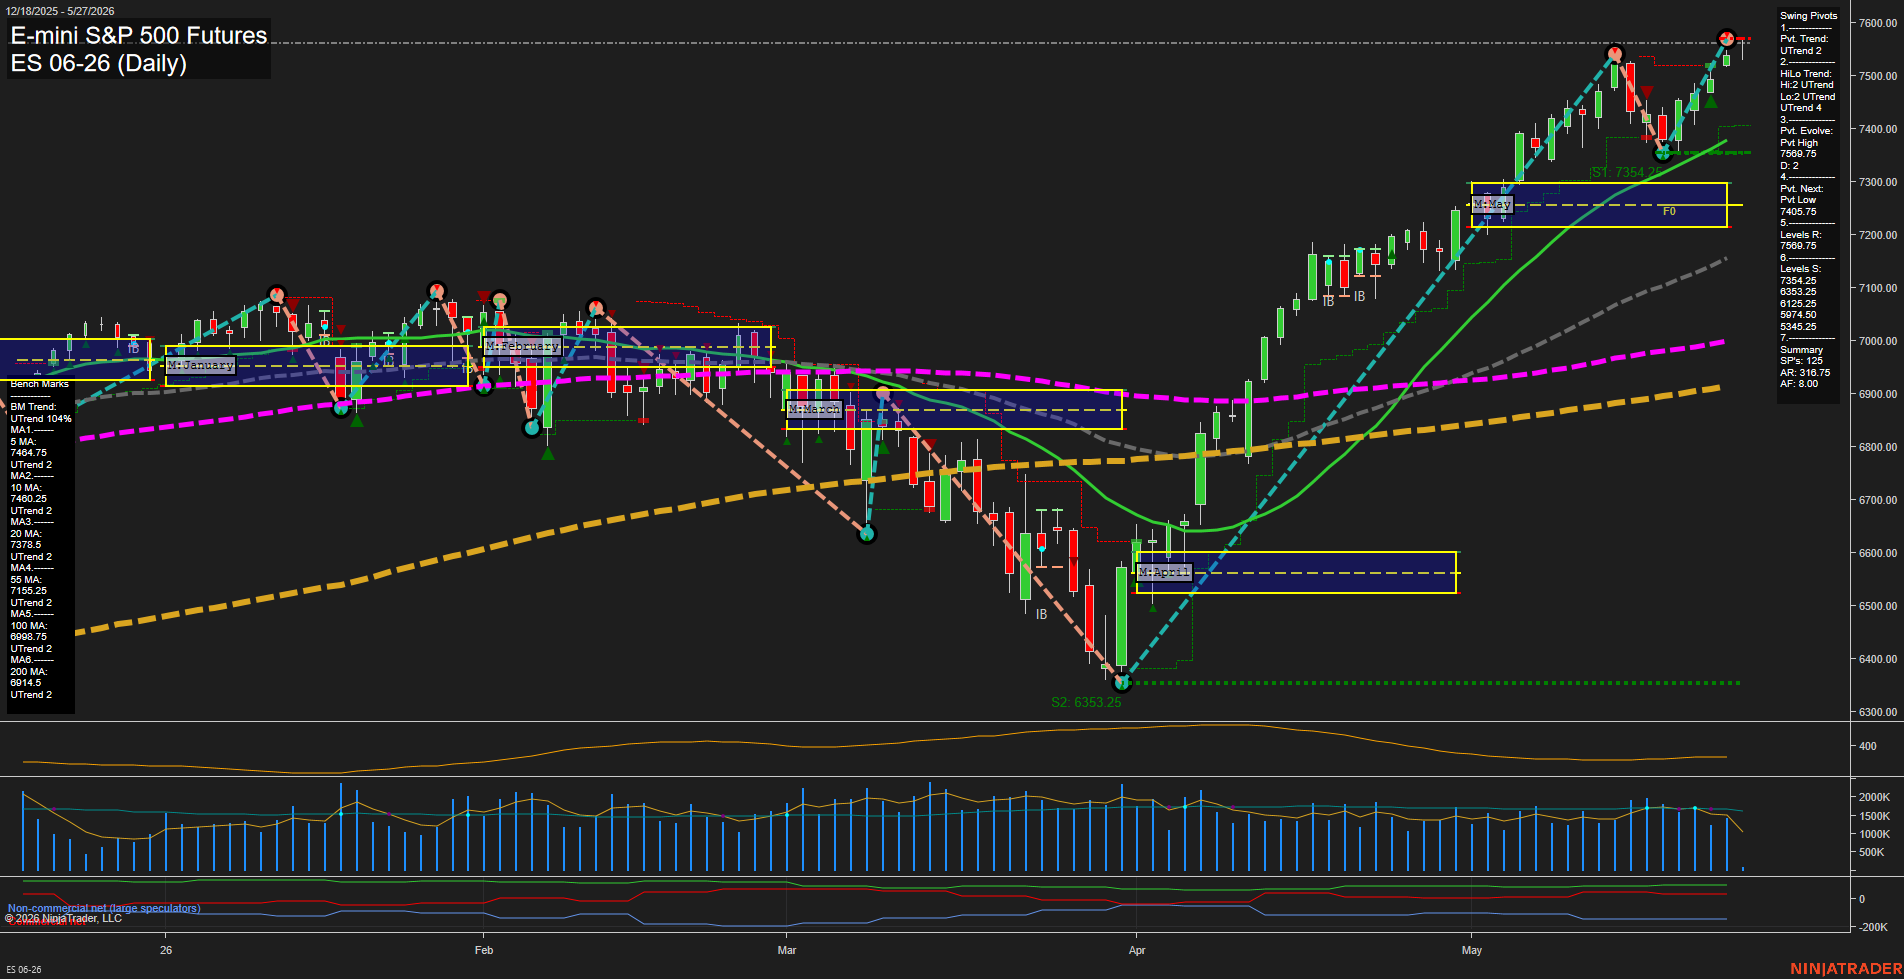
ES E-mini S&P 500 Futures Daily Chart Analysis: 2026-May-27 07:02 CT
Price Action
- Last: 7584.50,
- Bars: Medium,
- Mom: fast.
WSFG Weekly
- Short-Term
- WSFG Current: 17%
- F0%/NTZ' Bias: Price Above,
- WSFG Trend: Up.
MSFG Month May
- Intermediate-Term
- MSFG Current: 65%
- F0%/NTZ' Bias: Price Above,
- MSFG Trend: Up.
YSFG Year 2026
- Long-Term
- YSFG Current: 50%
- F0%/NTZ' Bias: Price Above,
- YSFG Trend: Up.
Swing Pivots
- (Short-Term) 1. Pvt. Trend: UTrend,
- (Intermediate-Term) 2. HiLo Trend: UTrend,
- 3. Pvt. Evolve: Pvt high 7569.75,
- 4. Pvt. Next: Pvt low 7405.75,
- 5. Levels R: 7569.75,
- 6. Levels S: 7354.25, 6333.25, 6125.25, 5974.50, 5345.25.
Daily Benchmarks
- (Short-Term) 5 Day: 7464.75 Up Trend,
- (Short-Term) 10 Day: 7460.25 Up Trend,
- (Intermediate-Term) 20 Day: 7378.50 Up Trend,
- (Intermediate-Term) 55 Day: 7155.25 Up Trend,
- (Long-Term) 100 Day: 6988.75 Up Trend,
- (Long-Term) 200 Day: 6914.50 Up Trend.
Additional Metrics
- ATR: 319,
- VOLMA: 1611996.
Recent Trade Signals
- 27 May 2026: Long ES 06-26 @ 7557.5 Signals.USAR-WSFG
- 20 May 2026: Long ES 06-26 @ 7451.5 Signals.USAR.TR120
Overall Rating
- Short-Term: Bullish,
- Intermediate-Term: Bullish,
- Long-Term: Bullish.
Key Insights Summary
The daily structure remains firmly trend-positive, with price pushing above the prior swing high at 7569.75 and holding well above all benchmark moving averages. The benchmark stack is fully aligned in bullish order, with the 5/10-day averages above the 20, 55, 100, and 200-day measures, confirming strong trend continuation across short, intermediate, and long horizons. Swing pivot trend reads UTrend on both the pivot and hi/lo metrics, while the recent advance off the April low shows a clean rally sequence with higher highs and higher lows. The monthly and weekly session fib grids both keep price above the f0%/NTZ line, reinforcing upward bias. Recent trade signals also remain consistent with upside continuation, reflecting strength after the May breakout and follow-through toward the upper end of the current swing range.
Chart Analysis ATS AI Generated: 2026-05-27 07:02 for Informational use only, not trading advice. Terms and Risk Disclosure Copyright © 2026. Algo Trading Systems LLC.