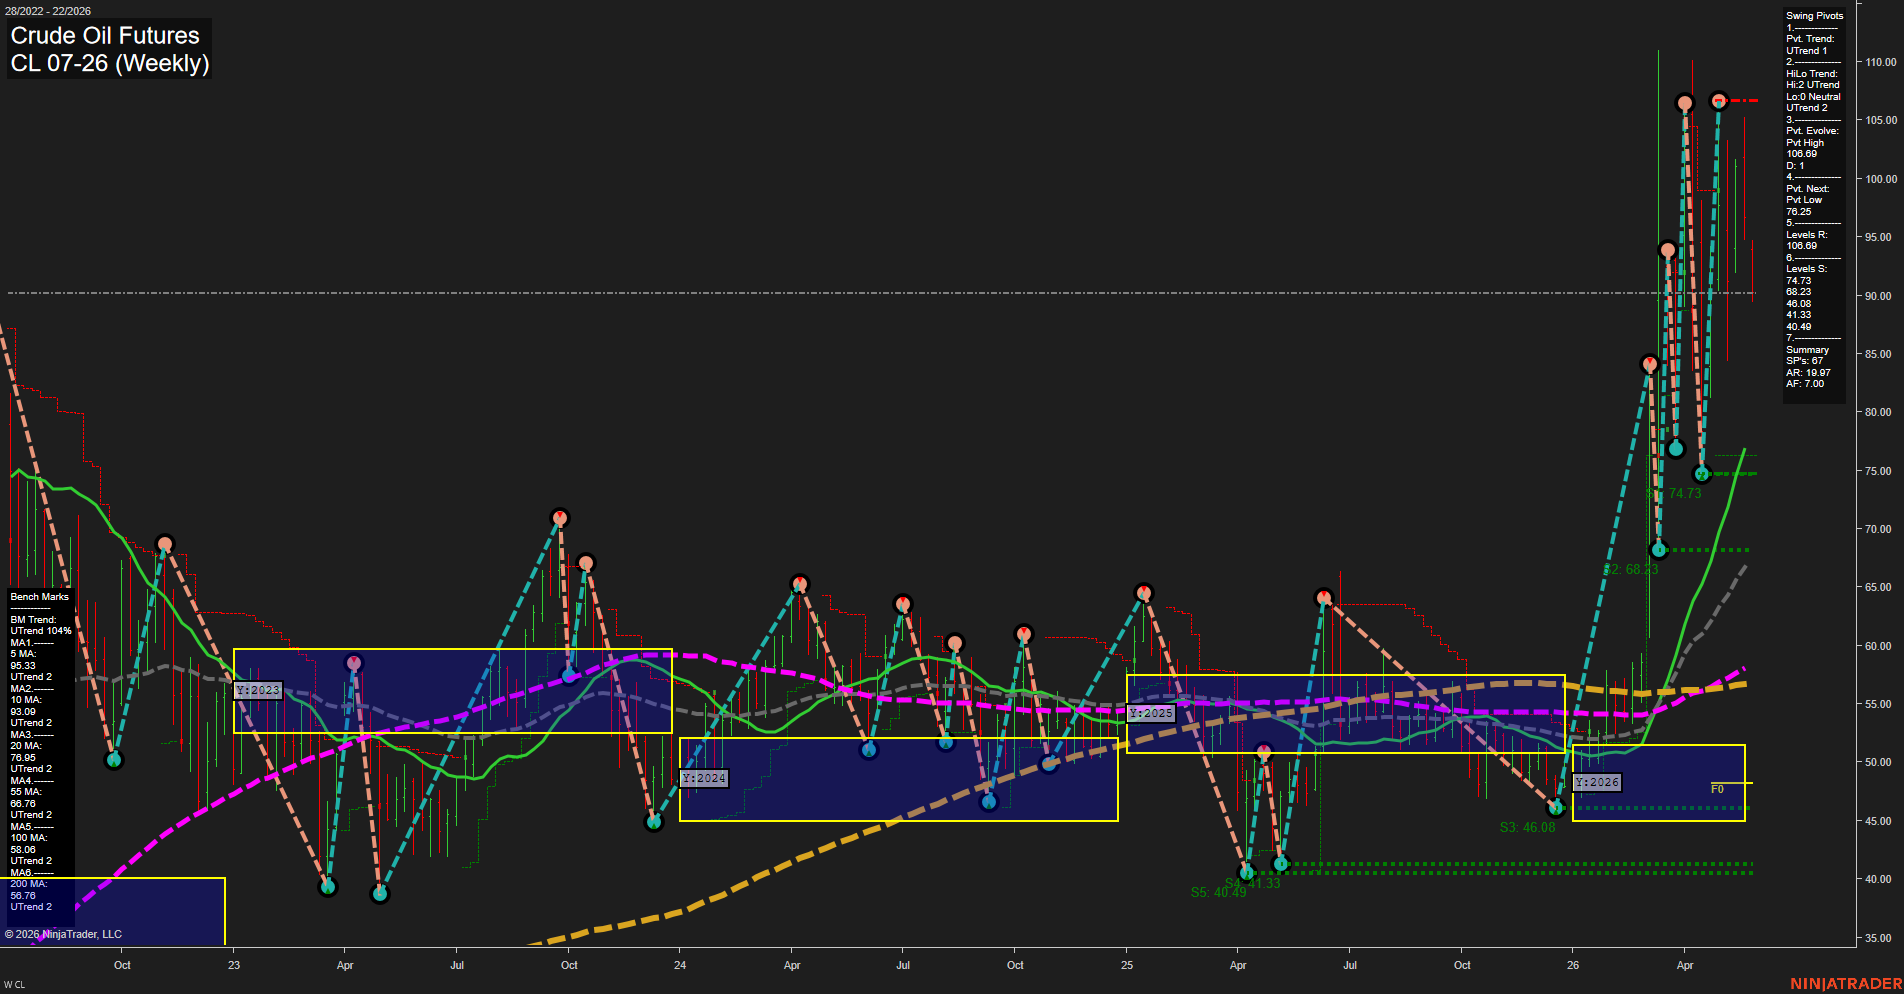
CL Crude Oil Futures Weekly Chart Analysis: 2026-May-27 07:01 CT
Price Action
- Last: 90.00,
- Bars: Large,
- Mom: fast.
WSFG Weekly
- Short-Term
- WSFG Current: -24%
- F0%/NTZ' Bias: Price Below,
- WSFG Trend: Down.
MSFG Month May
- Intermediate-Term
- MSFG Current: -43%
- F0%/NTZ' Bias: Price Below,
- MSFG Trend: Down.
YSFG Year 2026
- Long-Term
- YSFG Current: 129%
- F0%/NTZ' Bias: Price Above,
- YSFG Trend: Up.
Swing Pivots
- (Short-Term) 1. Pvt. Trend: UTrend,
- (Intermediate-Term) 2. HiLo Trend: UTrend,
- 3. Pvt. Evolve: Pvt High 108.69,
- 4. Pvt. Next: Pvt Low 78.25,
- 5. Levels R: 108.69,
- 6. Levels S: 74.73, 68.23, 48.08, 41.33, 40.49.
Weekly Benchmarks
- (Short-Term) 5 Day: 95.33 Down Trend,
- (Short-Term) 10 Day: 93.09 Down Trend,
- (Intermediate-Term) 20 Day: 79.96 Up Trend,
- (Intermediate-Term) 55 Day: 68.78 Up Trend,
- (Long-Term) 100 Day: 58.08 Up Trend,
- (Long-Term) 200 Day: 56.78 Up Trend.
Recent Trade Signals
- 27 May 2026: Short CL 07-26 @ 91.54 Signals.USAR-WSFG
- 25 May 2026: Short CL 07-26 @ 91.01 Signals.USAR.TR720
- 22 May 2026: Short CL 07-26 @ 97.55 Signals.USAR-MSFG
- 20 May 2026: Short CL 07-26 @ 99.23 Signals.USAR.TR120
Overall Rating
- Short-Term: Bearish,
- Intermediate-Term: Bearish,
- Long-Term: Bullish.
Key Insights Summary
Crude oil is showing a sharp weekly selloff with large range bars and fast downside momentum, pushing price back below the weekly and monthly F0%/NTZ centers. The short-term and intermediate-term session fib grids remain aligned to the downside, and the recent signal flow is consistently bearish across the weekly, monthly, and 720-trend frameworks. Even so, the swing pivot structure still shows an underlying UTrend in both the pivot trend and HiLo trend, while the longer moving average stack stays positively aligned and rising, keeping the broader long-term structure constructive despite the current pullback. The chart reflects a strong retracement from the 108.69 pivot high toward the mid-70s and upper-60s support bands, with the year-level grid still above the F0% center, indicating that the larger 2026 trend has not fully broken.
Chart Analysis ATS AI Generated: 2026-05-27 07:01 for Informational use only, not trading advice. Terms and Risk Disclosure Copyright © 2026. Algo Trading Systems LLC.