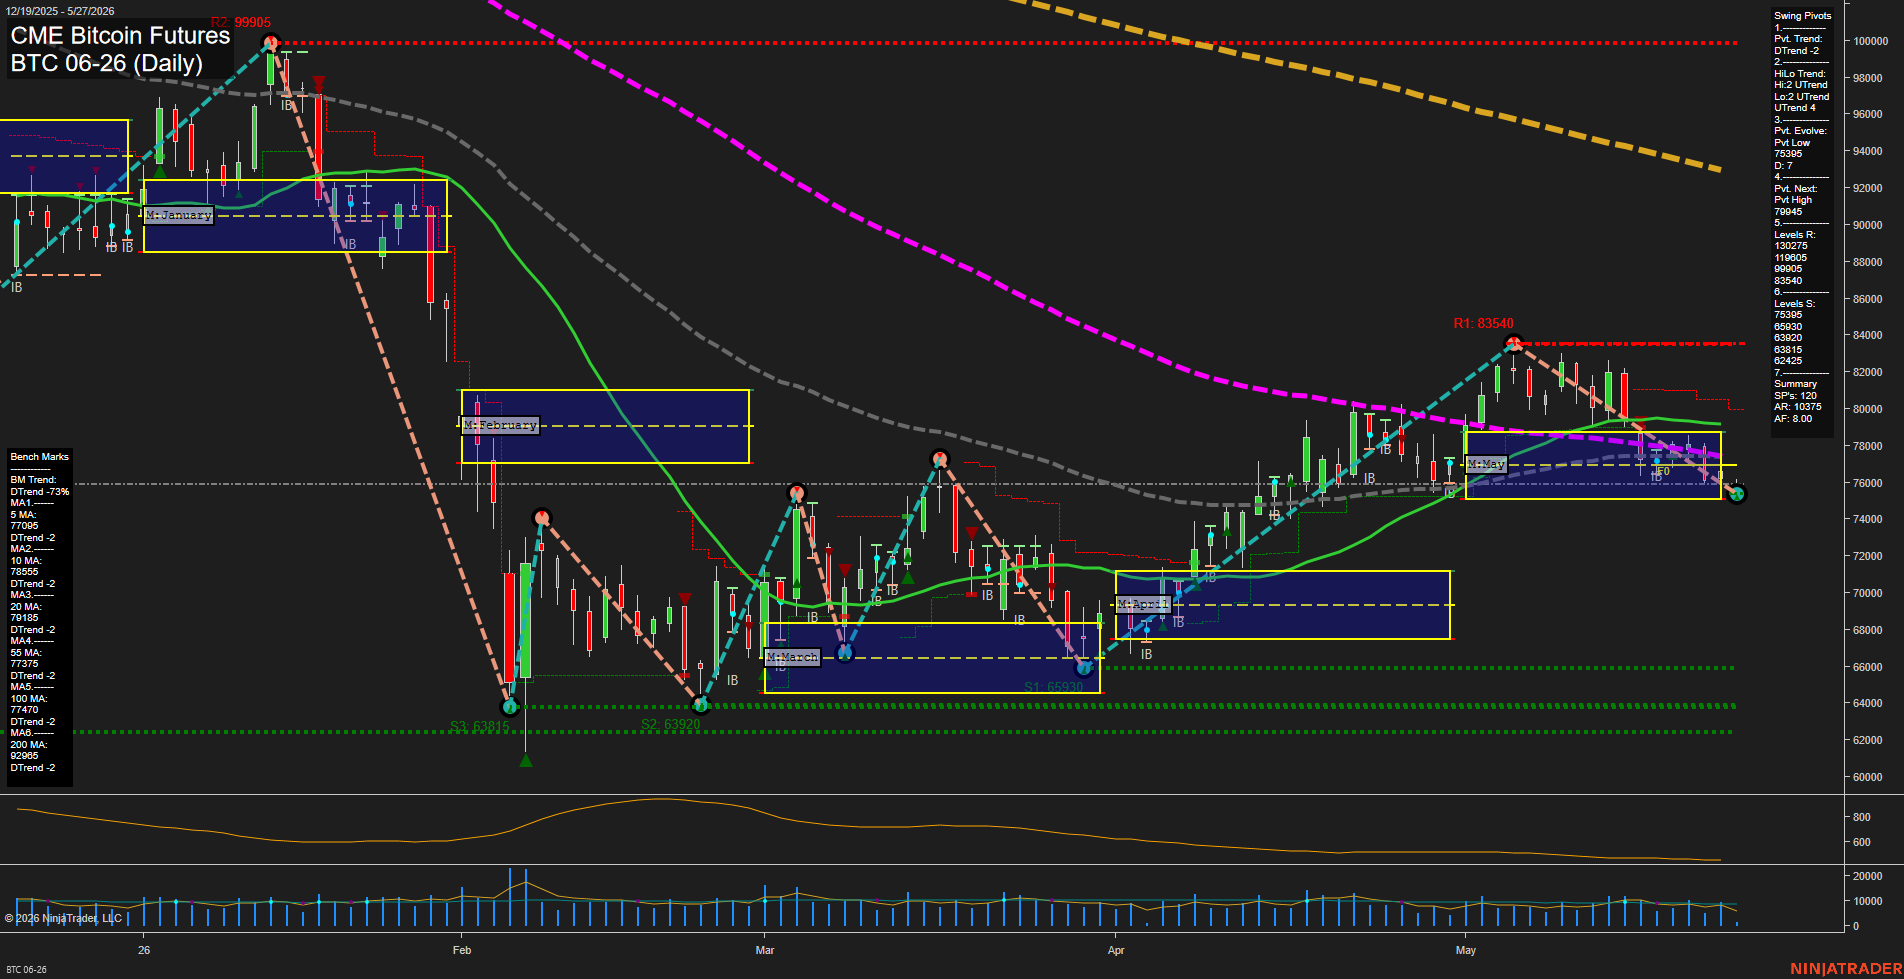
BTC CME Bitcoin Futures Daily Chart Analysis: 2026-May-27 07:01 CT
Price Action
- Last: 75395,
- Bars: Medium,
- Mom: average.
WSFG Weekly
- Short-Term
- WSFG Current: -17%
- F0%/NTZ' Bias: Price Below,
- WSFG Trend: Down.
MSFG Month May
- Intermediate-Term
- MSFG Current: -14%
- F0%/NTZ' Bias: Price Below,
- MSFG Trend: Down.
YSFG Year 2026
- Long-Term
- YSFG Current: -49%
- F0%/NTZ' Bias: Price Below,
- YSFG Trend: Down.
Swing Pivots
- (Short-Term) 1. Pvt. Trend: DTrend,
- (Intermediate-Term) 2. HiLo Trend: UTrend,
- 3. Pvt. Evolve: Pvt low 75395,
- 4. Pvt. Next: Pvt high 79945,
- 5. Levels R: 130275, 119605, 99905, 83540,
- 6. Levels S: 75395, 65930, 63920, 63815, 62425.
Daily Benchmarks
- (Short-Term) 5 Day: 77095 Down Trend,
- (Short-Term) 10 Day: 78555 Down Trend,
- (Intermediate-Term) 20 Day: 79185 Down Trend,
- (Intermediate-Term) 55 Day: 77375 Down Trend,
- (Long-Term) 100 Day: 77470 Down Trend,
- (Long-Term) 200 Day: 92985 Down Trend.
Additional Metrics
Recent Trade Signals
- 26 May 2026: Short BTC 06-26 @ 76055 Signals.USAR-WSFG
- 26 May 2026: Short BTC 06-26 @ 76055 Signals.USAR-MSFG
Overall Rating
- Short-Term: Bearish,
- Intermediate-Term: Bearish,
- Long-Term: Bearish.
Key Insights Summary
BTC CME Bitcoin Futures is trading below the weekly, monthly, and yearly F0%/NTZ reference zones, keeping the broader structure aligned with a downside bias. Daily price is sitting under the 5, 10, 20, 55, 100, and 200 day benchmarks, which confirms persistent bearish trend alignment across short, intermediate, and long horizons. The swing pivot structure shows a current DTrend with the most recent pivot low at 75395 and the next opposite pivot high marked at 79945, while overhead resistance remains stacked at 83540, 99905, 119605, and 130275. The chart reflects a failed recovery from the May advance, followed by a pullback back into the lower end of the May session fib area and near the current pivot low zone. Recent USAR short signals on the weekly and monthly session fib grids reinforce the downside trend condition, with volatility still present but not explosive, suggesting a bearish corrective-to-trend continuation backdrop rather than a clean reversal structure.
Chart Analysis ATS AI Generated: 2026-05-27 07:01 for Informational use only, not trading advice. Terms and Risk Disclosure Copyright © 2026. Algo Trading Systems LLC.