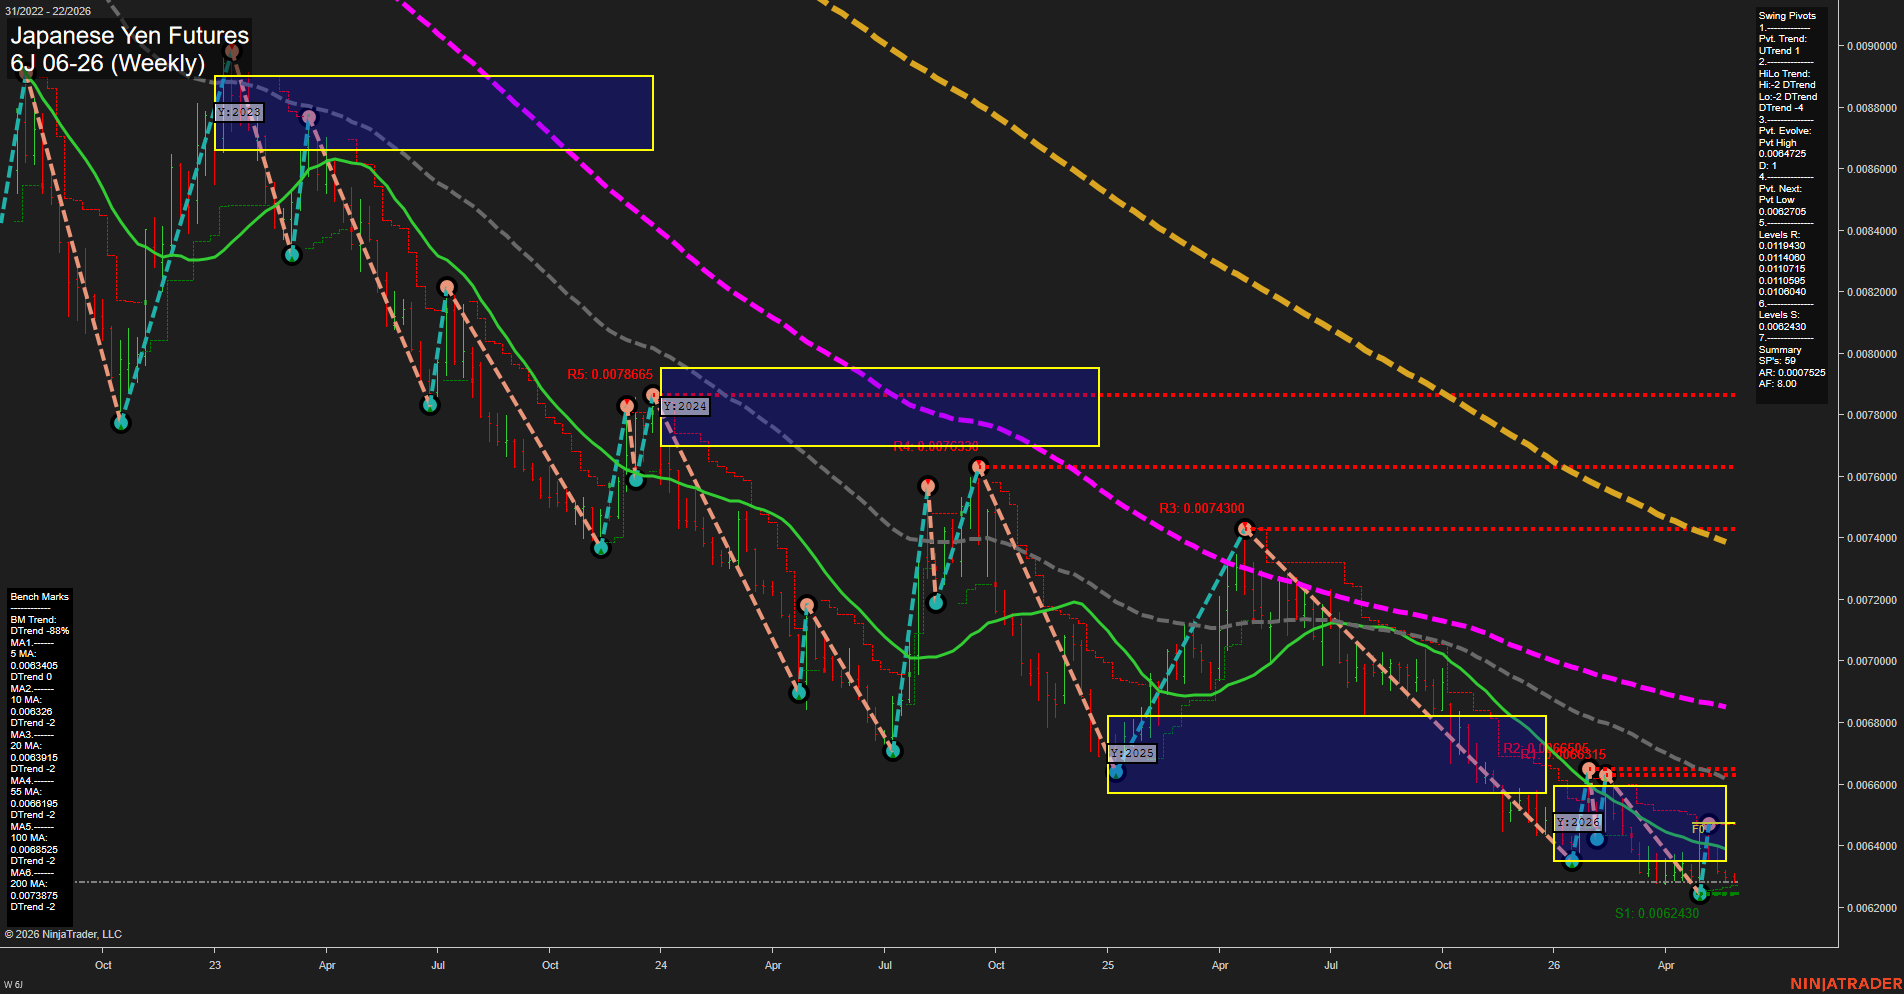
6J Japanese Yen Futures Weekly Chart Analysis: 2026-May-27 07:01 CT
Price Action
- Last: 0.006315,
- Bars: Medium,
- Mom: average.
WSFG Weekly
- Short-Term
- WSFG Current: -16%
- F0%/NTZ' Bias: Price Below,
- WSFG Trend: Down.
MSFG Month May
- Intermediate-Term
- MSFG Current: -55%
- F0%/NTZ' Bias: Price Below,
- MSFG Trend: Down.
YSFG Year 2026
- Long-Term
- YSFG Current: -16%
- F0%/NTZ' Bias: Price Below,
- YSFG Trend: Down.
Swing Pivots
- (Short-Term) 1. Pvt. Trend: UTrend,
- (Intermediate-Term) 2. HiLo Trend: DTrend,
- 3. Pvt. Evolve: Pvt High 0.0064725,
- 4. Pvt. Next: Pvt Low 0.0062705,
- 5. Levels R: 0.0119430, 0.0114060, 0.0110715, 0.0110595, 0.0106040,
- 6. Levels S: 0.0062430.
Weekly Benchmarks
- (Short-Term) 5 Day: 0.0063405 Down Trend,
- (Short-Term) 10 Day: 0.006326 Down Trend,
- (Intermediate-Term) 20 Day: 0.0063915 Down Trend,
- (Intermediate-Term) 55 Day: 0.0068195 Down Trend,
- (Long-Term) 100 Day: 0.0068525 Down Trend,
- (Long-Term) 200 Day: 0.0073875 Down Trend.
Recent Trade Signals
- 27 May 2026: Short 6J 06-26 @ 0.006285 Signals.USAR-WSFG
Overall Rating
- Short-Term: Bearish,
- Intermediate-Term: Bearish,
- Long-Term: Bearish.
Key Insights Summary
Japanese Yen futures remain in a broad downtrend with price trading below the weekly, monthly, and yearly F0%/NTZ reference zones, confirming persistent downside structure across all timeframes. The weekly swing pivot trend has turned up on the shortest pivot sequence, but the broader HiLo pivot structure is still bearish, showing that the current bounce is occurring inside a larger decline rather than reversing it. All benchmark moving averages are stacked in bearish alignment and sloping lower, with price still below the 5, 10, 20, 55, 100, and 200-day measures. The chart shows repeated lower highs and lower lows, with rallies into resistance failing to hold and the market compressing near the lower band of the yearly grid. The latest signal aligns with the broader trend, while the nearby pivot support near 0.0062430 defines the active swing floor and the recent high near 0.0064725 marks the latest countertrend rebound point.
Chart Analysis ATS AI Generated: 2026-05-27 07:01 for Informational use only, not trading advice. Terms and Risk Disclosure Copyright © 2026. Algo Trading Systems LLC.