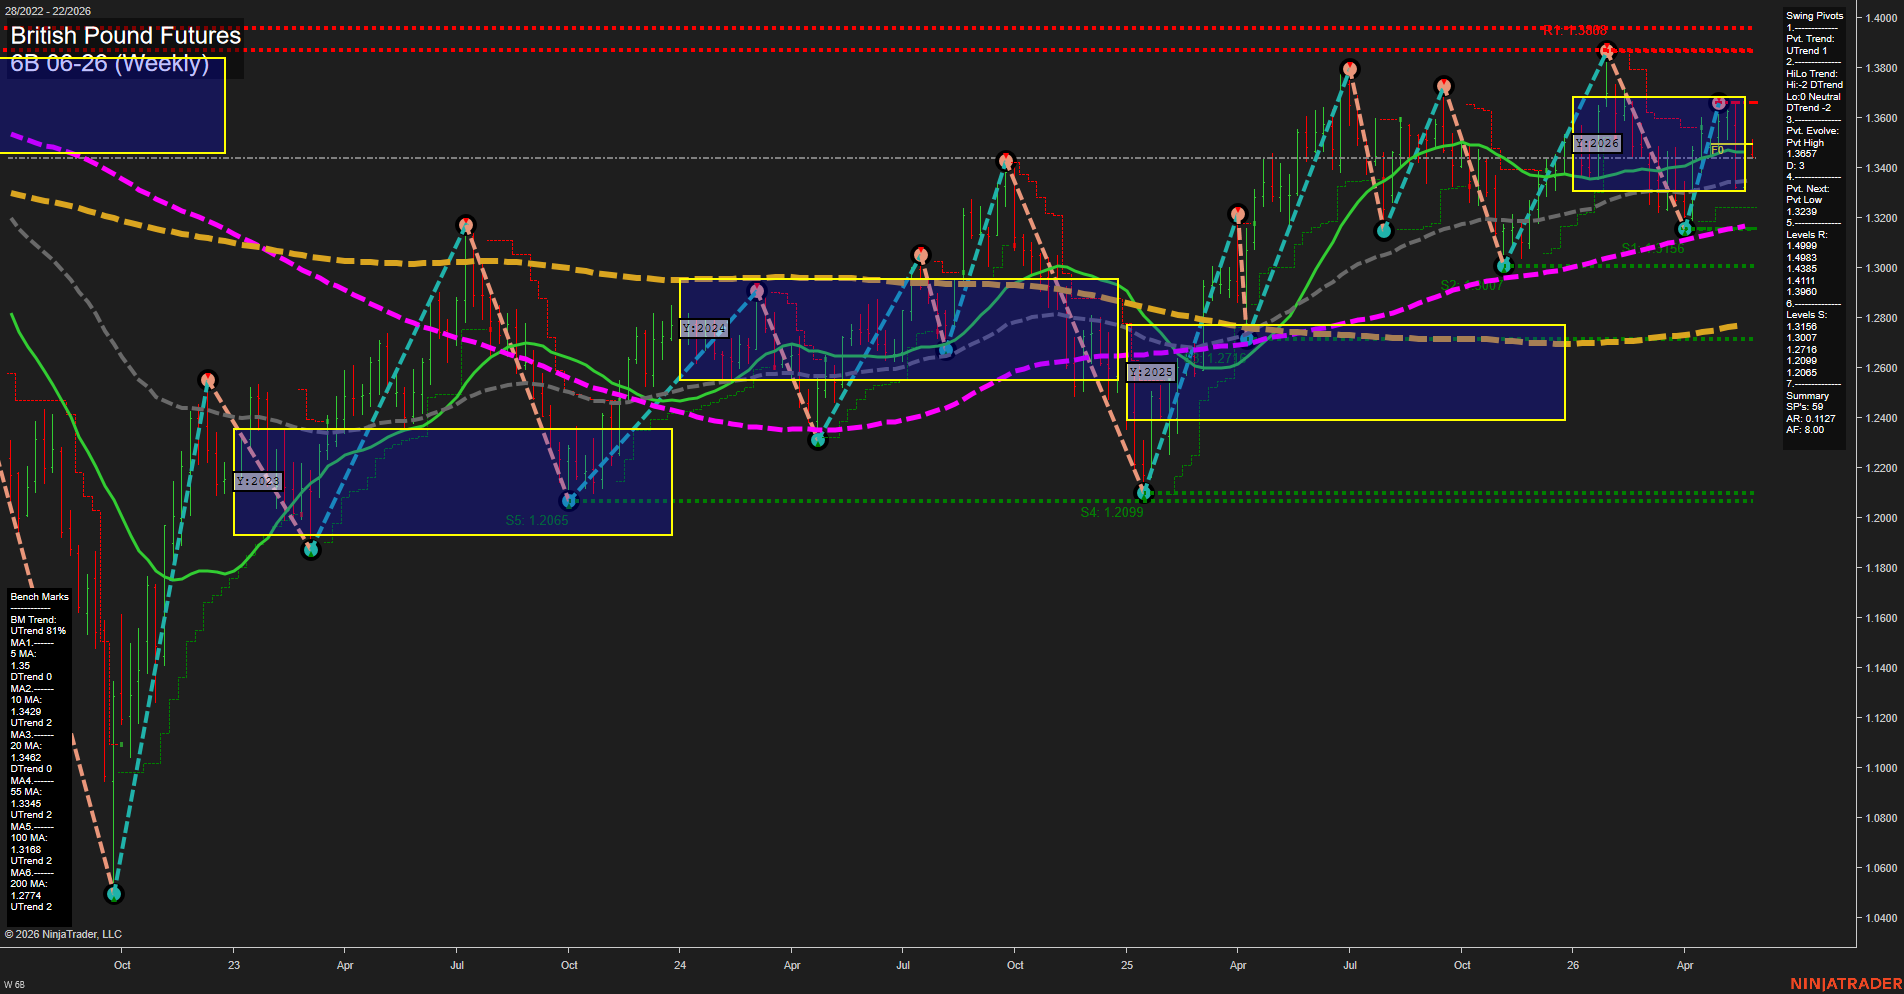
6B British Pound Futures Weekly Chart Analysis: 2026-May-27 07:00 CT
Price Action
- Last: 1.3857,
- Bars: Large,
- Mom: Fast.
WSFG Weekly
- Short-Term
- WSFG Current: -8%
- F0%/NTZ' Bias: Price Below,
- WSFG Trend: Down.
MSFG Month May
- Intermediate-Term
- MSFG Current: -53%
- F0%/NTZ' Bias: Price Below,
- MSFG Trend: Down.
YSFG Year 2026
- Long-Term
- YSFG Current: -3%
- F0%/NTZ' Bias: Price Below,
- YSFG Trend: Down.
Swing Pivots
- (Short-Term) 1. Pvt. Trend: UTrend,
- (Intermediate-Term) 2. HiLo Trend: DTrend,
- 3. Pvt. Evolve: Pvt High 1.3857,
- 4. Pvt. Next: Pvt Low 1.3239,
- 5. Levels R: 1.4999, 1.4983, 1.4385, 1.4111, 1.3960,
- 6. Levels S: 1.3158, 1.3007, 1.2716, 1.2099, 1.2065.
Weekly Benchmarks
- (Short-Term) 5 Day: 1.3500 Down Trend,
- (Short-Term) 10 Day: 1.3429 Up Trend,
- (Intermediate-Term) 20 Day: 1.3462 Up Trend,
- (Intermediate-Term) 55 Day: 1.3345 Up Trend,
- (Long-Term) 100 Day: 1.3168 Up Trend,
- (Long-Term) 200 Day: 1.2774 Up Trend.
Recent Trade Signals
- 25 May 2026: Long 6B 06-26 @ 1.3483 Signals.USAR-WSFG
Overall Rating
- Short-Term: Bullish,
- Intermediate-Term: Bearish,
- Long-Term: Neutral.
Key Insights Summary
Weekly price is pressing near the upper end of the 2026 YSFG box after a strong impulse off the spring lows, with a fast momentum profile and a clear sequence of higher swing highs and higher swing lows into the recent peak at 1.3857. The short-term pivot structure remains constructive even though the weekly, monthly, and yearly session fib grids are still tagged below their center lines, which keeps the broader session-fib bias negative. The benchmark stack is still supportive underneath price, with the 20, 55, 100, and 200 day averages all rising beneath the market, showing that the larger trend has rebuilt from the prior selloff. Resistance is layered overhead at 1.3960, then 1.4111 and 1.4385, while nearby support is clustered at 1.3158, 1.3007, and 1.2716. The chart is in a bullish recovery phase on the weekly swing structure, but the intermediate session-fib read remains down, so the bigger picture is still a transition zone between corrective pressure and trend continuation.
Chart Analysis ATS AI Generated: 2026-05-27 07:00 for Informational use only, not trading advice. Terms and Risk Disclosure Copyright © 2026. Algo Trading Systems LLC.