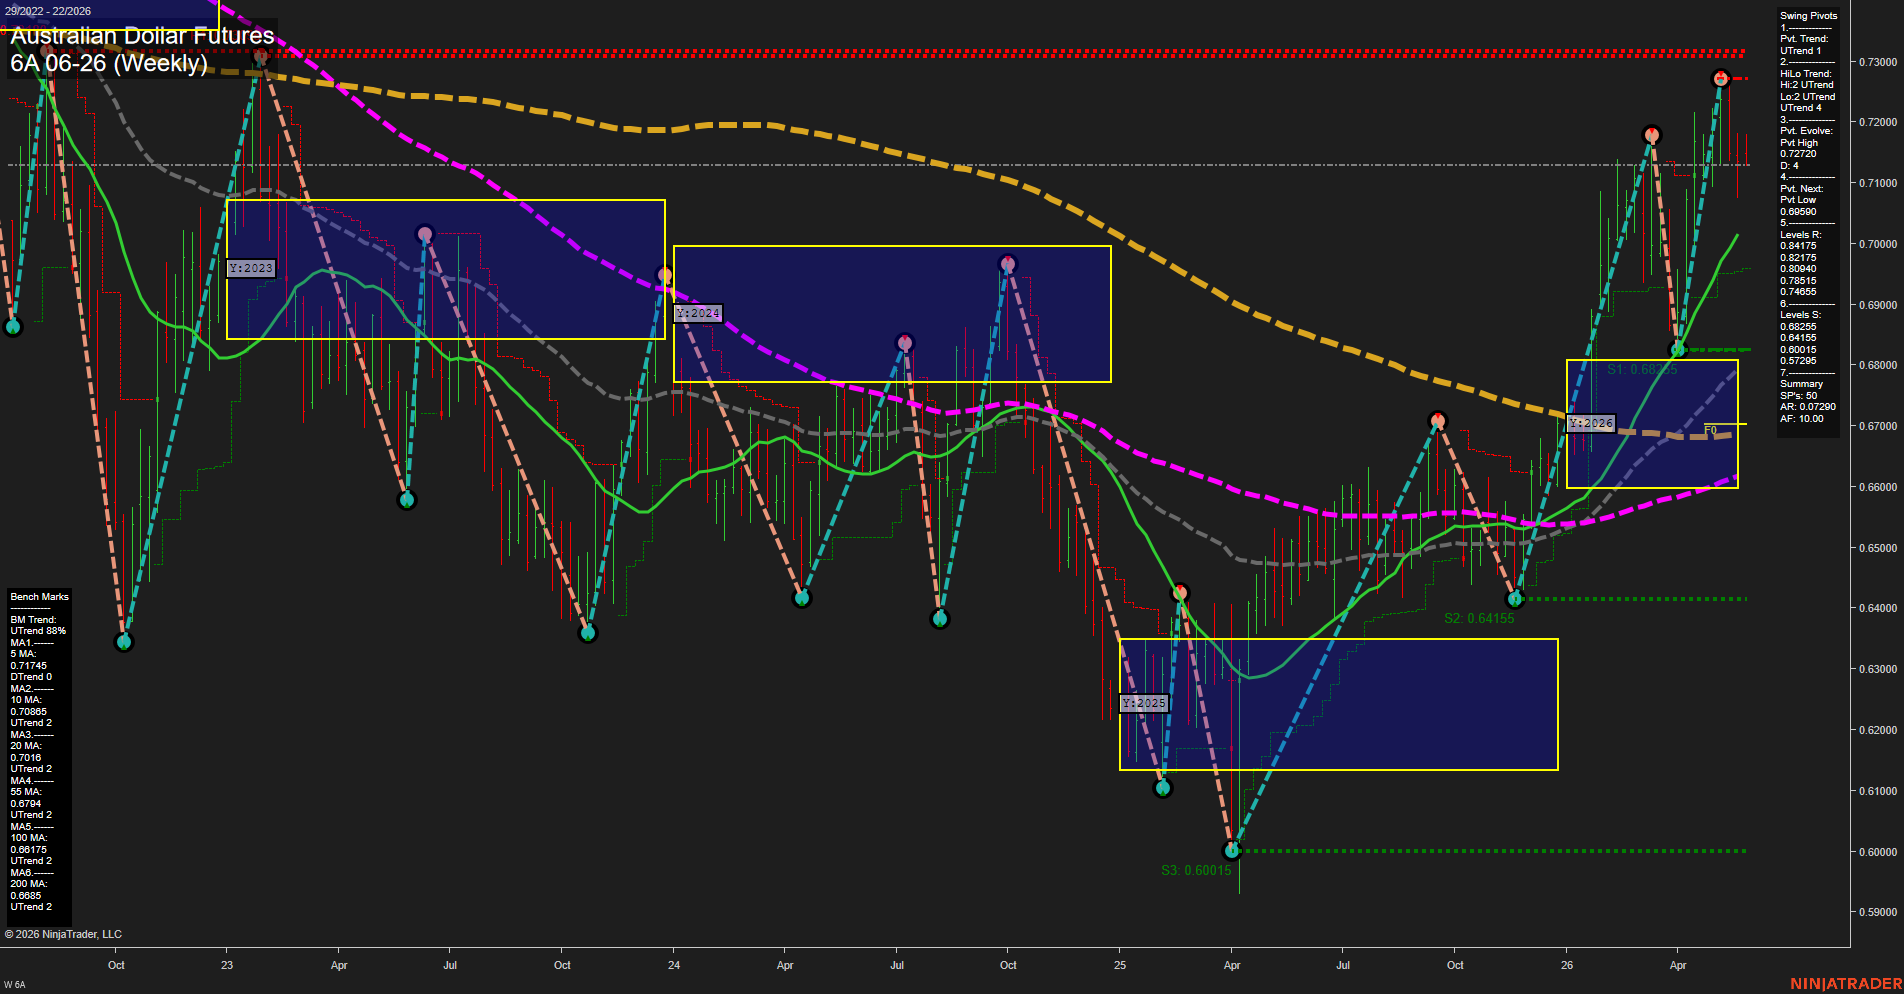
6A Australian Dollar Futures Weekly Chart Analysis: 2026-May-27 07:00 CT
Price Action
- Last: 0.7140,
- Bars: Large,
- Mom: fast.
WSFG Weekly
- Short-Term
- WSFG Current: NA%
- F0%/NTZ' Bias: Price Neutral,
- WSFG Trend: Neutral.
MSFG Month May
- Intermediate-Term
- MSFG Current: NA%
- F0%/NTZ' Bias: Price Neutral,
- MSFG Trend: Neutral.
YSFG Year 2026
- Long-Term
- YSFG Current: NA%
- F0%/NTZ' Bias: Price Neutral,
- YSFG Trend: Neutral.
Swing Pivots
- (Short-Term) 1. Pvt. Trend: UTrend,
- (Intermediate-Term) 2. HiLo Trend: UTrend,
- 3. Pvt. Evolve: Pvt High 0.72720,
- 4. Pvt. Next: Pvt Low 0.69590,
- 5. Levels R: 0.84175, 0.82175, 0.80940, 0.78515, 0.74855,
- 6. Levels S: 0.68255, 0.64155, 0.60015, 0.57295.
Weekly Benchmarks
- (Short-Term) 5 Day: 0.71745 Up Trend,
- (Short-Term) 10 Day: 0.70865 Up Trend,
- (Intermediate-Term) 20 Day: 0.70160 Up Trend,
- (Intermediate-Term) 55 Day: 0.67940 Up Trend,
- (Long-Term) 100 Day: 0.68175 Up Trend,
- (Long-Term) 200 Day: 0.66850 Up Trend.
Recent Trade Signals
- 27 May 2026: Short 6A 06-26 @ 0.7132 Signals.USAR-WSFG
- 27 May 2026: Short 6A 06-26 @ 0.71355 Signals.USAR-MSFG
Overall Rating
- Short-Term: Neutral,
- Intermediate-Term: Bullish,
- Long-Term: Bullish.
Key Insights Summary
The weekly structure shows a strong recovery trend from the 2025 selloff low near 0.60015, with price now pressing into the upper part of the 2026 range and trading above the 20, 55, 100, and 200-day benchmarks. Swing pivots remain in UTrend on both the short and intermediate views, confirming a higher-high and higher-low sequence, while the next downside pivot reference sits at 0.69590 and the key overhead pivot high is 0.72720. The current candle is large and fast, reflecting expanded momentum after a sharp upside leg, but the recent short WSFG and MSFG signals show the market is working through a test area near prior resistance and the year-to-date NTZ upper zone. Overall, the chart carries a constructive bullish bias on the higher time frames, with price still needing acceptance above the recent pivot high region to extend the existing rally structure.
Chart Analysis ATS AI Generated: 2026-05-27 07:00 for Informational use only, not trading advice. Terms and Risk Disclosure Copyright © 2026. Algo Trading Systems LLC.