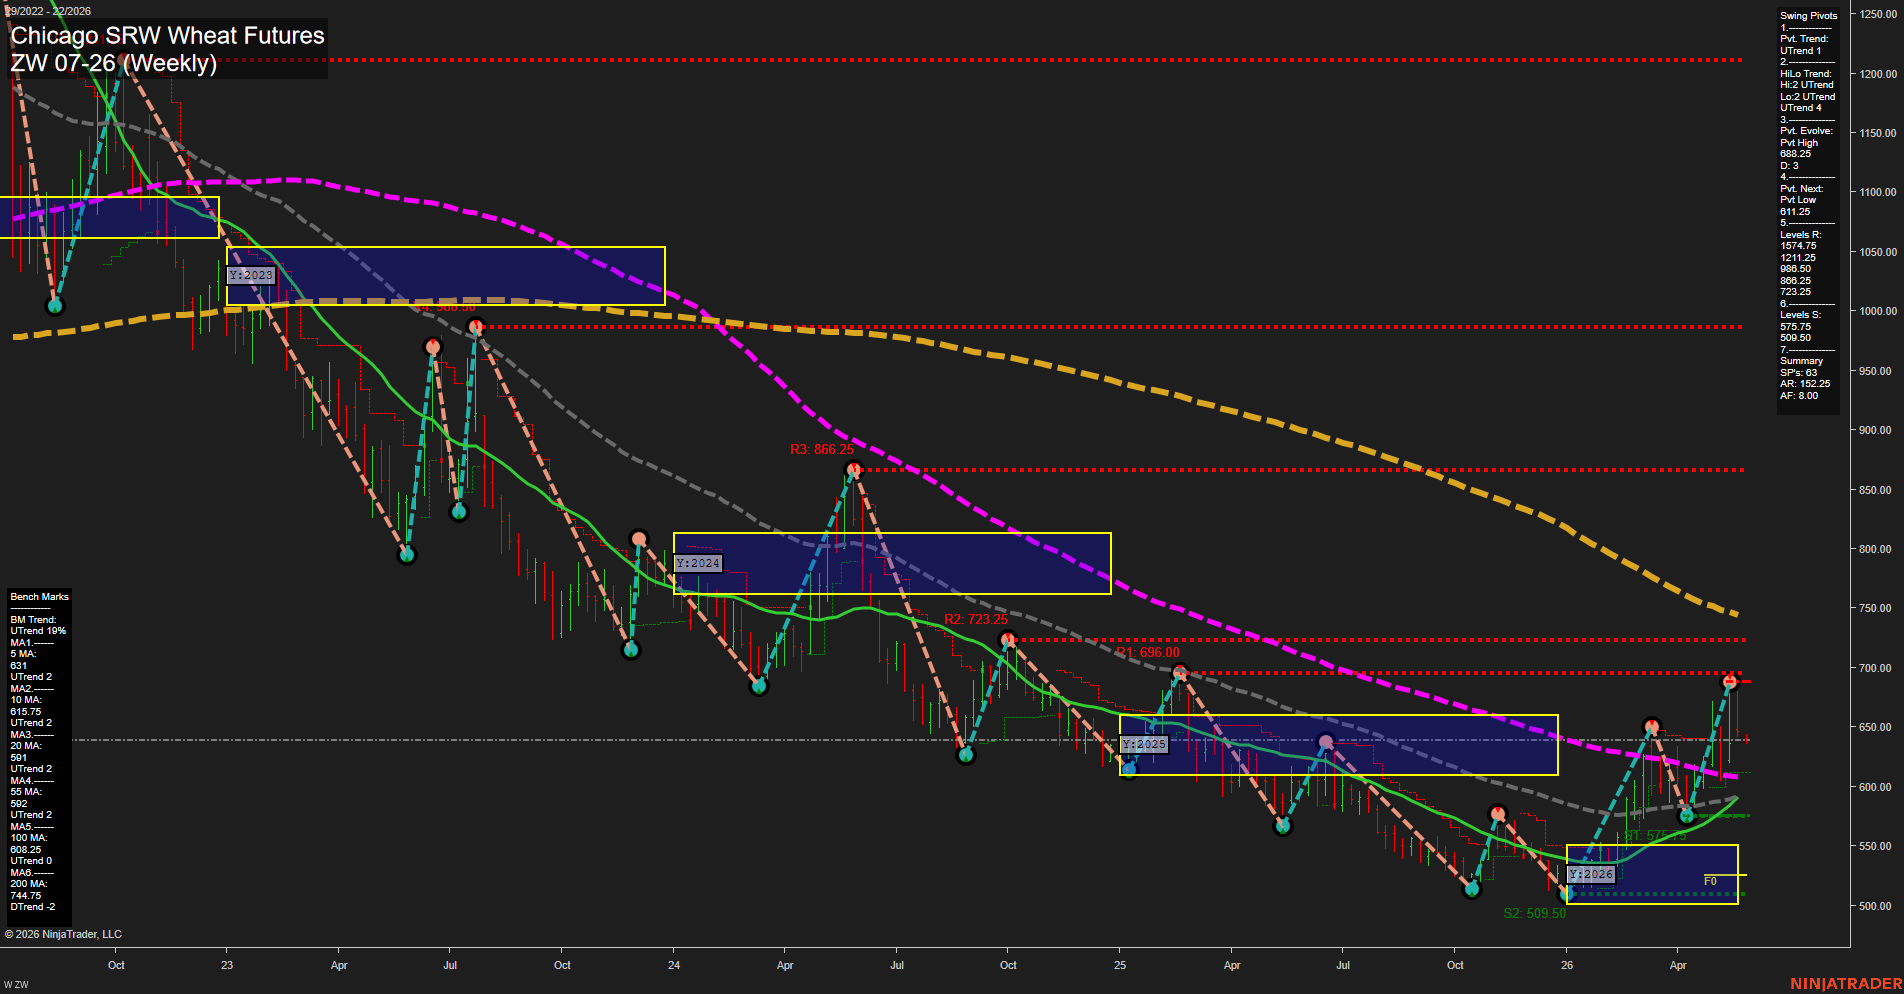
ZW Chicago SRW Wheat Futures Weekly Chart Analysis: 2026-May-26 07:10 CT
Price Action
- Last: 688.25,
- Bars: Large,
- Mom: fast.
WSFG Weekly
- Short-Term
- WSFG Current: -1%
- F0%/NTZ' Bias: Price Below,
- WSFG Trend: Down.
MSFG Month May
- Intermediate-Term
- MSFG Current: -5%
- F0%/NTZ' Bias: Price Below,
- MSFG Trend: Down.
YSFG Year 2026
- Long-Term
- YSFG Current: 46%
- F0%/NTZ' Bias: Price Above,
- YSFG Trend: Up.
Swing Pivots
- (Short-Term) 1. Pvt. Trend: UTrend,
- (Intermediate-Term) 2. HiLo Trend: UTrend,
- 3. Pvt. Evolve: Pvt High 688.25,
- 4. Pvt. Next: Pvt Low 611.25,
- 5. Levels R: 1211.25, 986.50, 806.25, 723.25,
- 6. Levels S: 575.75, 509.50.
Weekly Benchmarks
- (Short-Term) 5 Day: 631 Up Trend,
- (Short-Term) 10 Day: 615.75 Up Trend,
- (Intermediate-Term) 20 Day: 591 Up Trend,
- (Intermediate-Term) 55 Day: 592 Up Trend,
- (Long-Term) 100 Day: 608.25 Up Trend,
- (Long-Term) 200 Day: 744.75 Down Trend.
Recent Trade Signals
- 21 May 2026: Short ZW 07-26 @ 652.5 Signals.USAR.TR120
- 18 May 2026: Long ZW 07-26 @ 657.75 Signals.USAR-WSFG
Overall Rating
- Short-Term: Bullish,
- Intermediate-Term: Neutral,
- Long-Term: Neutral.
Key Insights Summary
Wheat remains in a broader down-sloping multi-year structure, but the most recent weekly action has turned sharply higher from the 2026 support zone near 509.50, with a fast momentum rebound and a fresh short-term pivot high at 688.25. The weekly and monthly session fib grids are still below their F0% centers, keeping those horizons structurally down, yet the yearly grid is above F0% and aligned with an improving long-term backdrop. Benchmarks are stacked positively across the 5, 10, 20, 55, and 100 day averages, while the 200 day average still slopes lower and sits overhead, so the chart is showing a strong recovery phase inside a larger mixed-to-bearish long-cycle framework. The recent short signal was quickly followed by a long signal, matching a market that has transitioned from selloff to rebound and is now probing resistance after a V-shaped recovery off the lows.
Chart Analysis ATS AI Generated: 2026-05-26 07:11 for Informational use only, not trading advice. Terms and Risk Disclosure Copyright © 2026. Algo Trading Systems LLC.