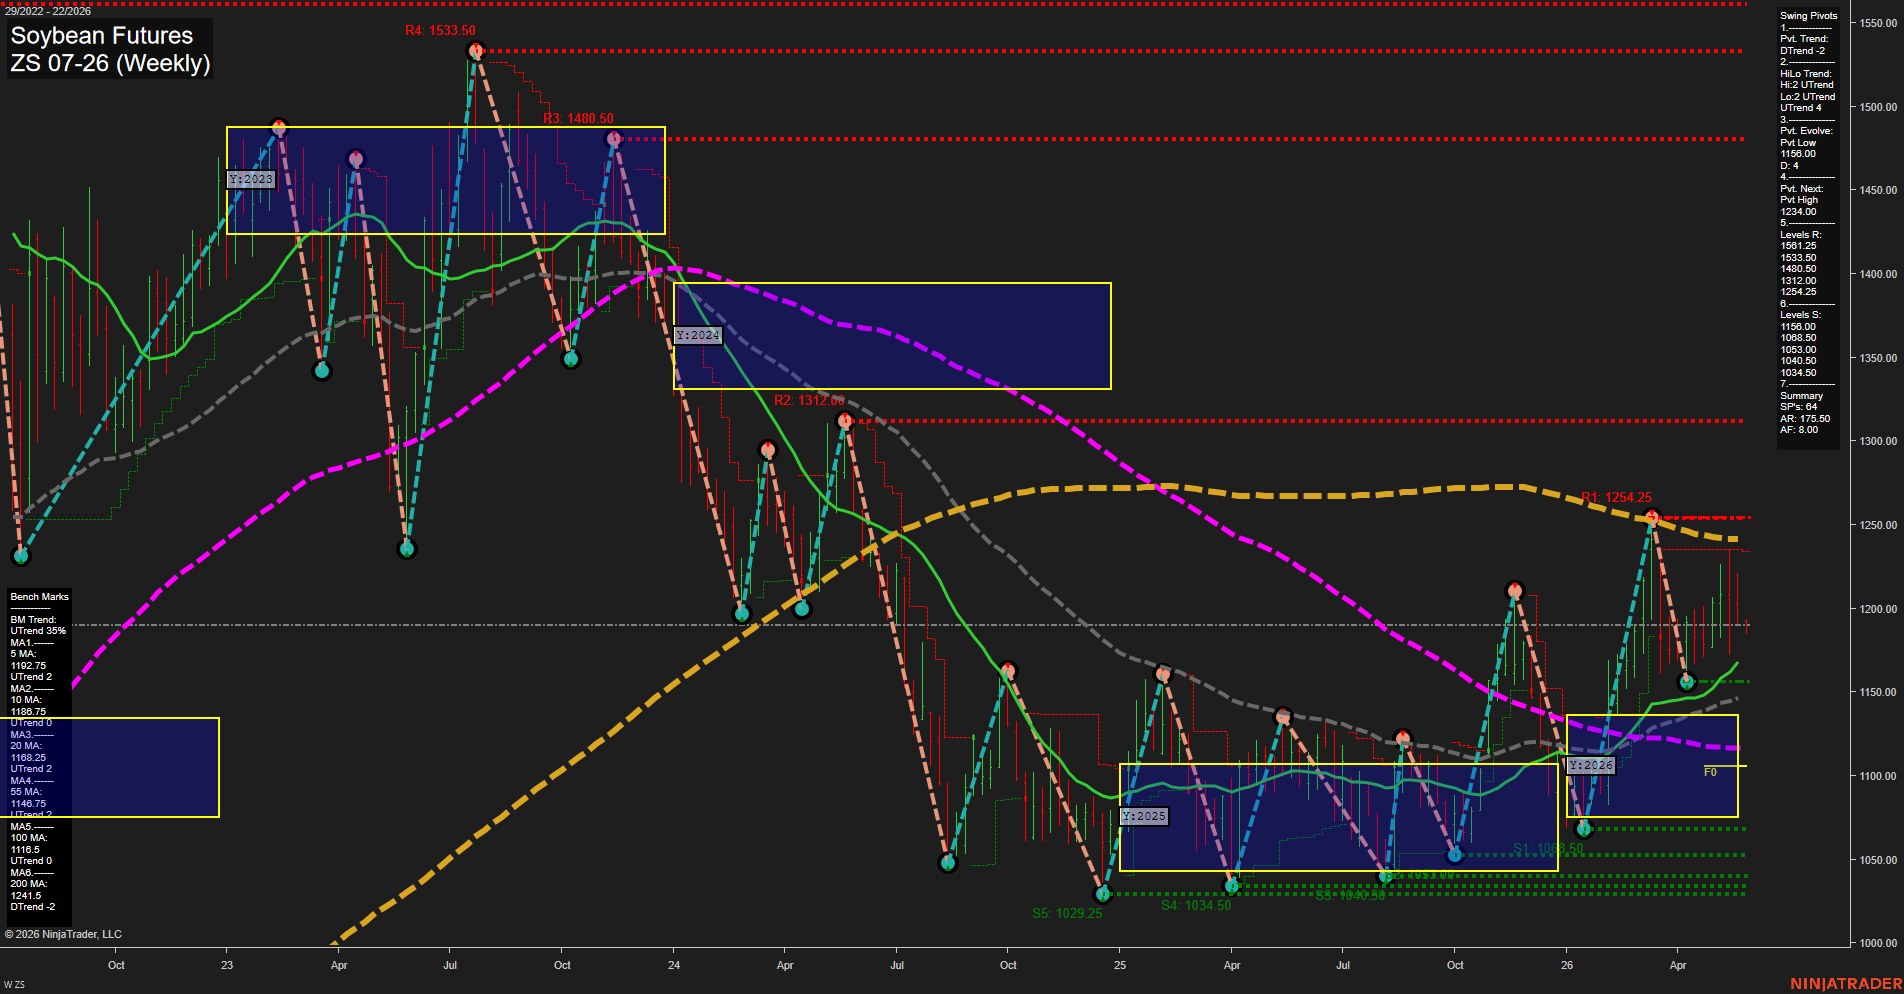
ZS Soybean Futures Weekly Chart Analysis: 2026-May-26 07:10 CT
Price Action
- Last: 1190.00,
- Bars: Medium,
- Mom: average.
WSFG Weekly
- Short-Term
- WSFG Current: -4%
- F0%/NTZ' Bias: Price Below,
- WSFG Trend: Down.
MSFG Month May
- Intermediate-Term
- MSFG Current: -18%
- F0%/NTZ' Bias: Price Below,
- MSFG Trend: Down.
YSFG Year 2026
- Long-Term
- YSFG Current: 28%
- F0%/NTZ' Bias: Price Above,
- YSFG Trend: Up.
Swing Pivots
- (Short-Term) 1. Pvt. Trend: DTrend,
- (Intermediate-Term) 2. HiLo Trend: UTrend,
- 3. Pvt. Evolve: Pvt Low 1158.00,
- 4. Pvt. Next: Pvt High 1234.00,
- 5. Levels R: 1561.25, 1533.50, 1480.50, 1312.00, 1254.25,
- 6. Levels S: 1158.00, 1068.50, 1053.00, 1040.50, 1034.50.
Weekly Benchmarks
- (Short-Term) 5 Day: 1192.75 Up Trend,
- (Short-Term) 10 Day: 1186.75 Up Trend,
- (Intermediate-Term) 20 Day: 1168.25 Up Trend,
- (Intermediate-Term) 55 Day: 1146.75 Down Trend,
- (Long-Term) 100 Day: 1116.50 Up Trend,
- (Long-Term) 200 Day: 1241.50 Down Trend.
Recent Trade Signals
- 26 May 2026: Short ZS 07-26 @ 1186.75 Signals.USAR-WSFG
- 26 May 2026: Short ZS 07-26 @ 1189.25 Signals.USAR-MSFG
- 20 May 2026: Short ZS 07-26 @ 1197.5 Signals.USAR.TR120
Overall Rating
- Short-Term: Bearish,
- Intermediate-Term: Bearish,
- Long-Term: Neutral.
Key Insights Summary
Soybeans are trading near the 1190 area after a wide multi-year swing decline from the 2024 peak, with current weekly price action still sitting below the weekly and monthly fib grid midlines and carrying a downside bias in both the WSFG and MSFG structures. The short-term pivot model is in DTrend, matching the recent cluster of short signals, while the HiLo pivot structure remains constructive enough to suggest the larger swing sequence is still rebuilding rather than fully breaking down. Benchmarks are mixed: the 5, 10, and 20 day measures are stacked above price and leaning supportive on the nearer-term rebound, but the 55 day remains below and the 200 day is still in a down trend, keeping the broader structure incomplete. Yearly positioning is the main offset, with 2026 price above the YSFG midpoint and the long-term yearly grid still pointing up, which leaves the market in a longer-range recovery phase even as the weekly and monthly swing layers remain under pressure.
Chart Analysis ATS AI Generated: 2026-05-26 07:10 for Informational use only, not trading advice. Terms and Risk Disclosure Copyright © 2026. Algo Trading Systems LLC.