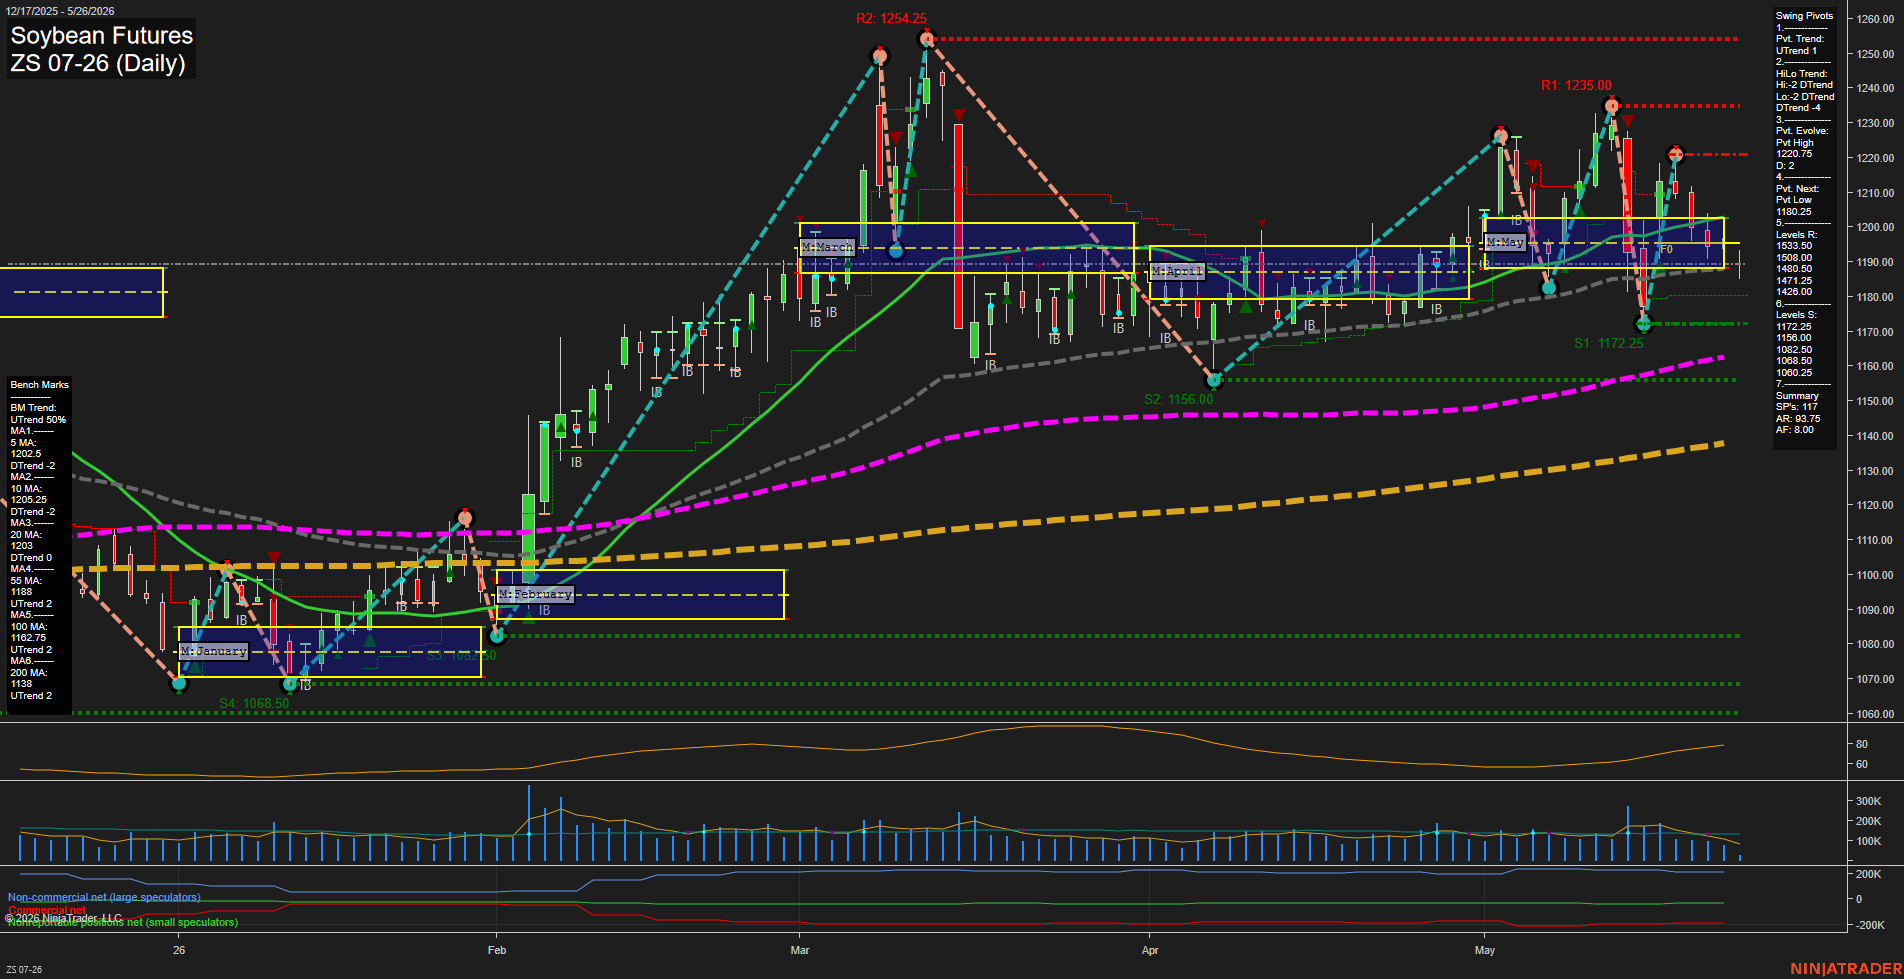
ZS Soybean Futures Daily Chart Analysis: 2026-May-26 07:10 CT
Price Action
- Last: 1192.50,
- Bars: Large,
- Mom: Fast.
WSFG Weekly
- Short-Term
- WSFG Current: -4%
- F0%/NTZ' Bias: Price Below,
- WSFG Trend: Down.
MSFG Month May
- Intermediate-Term
- MSFG Current: -18%
- F0%/NTZ' Bias: Price Below,
- MSFG Trend: Down.
YSFG Year 2026
- Long-Term
- YSFG Current: 28%
- F0%/NTZ' Bias: Price Above,
- YSFG Trend: Up.
Swing Pivots
- (Short-Term) 1. Pvt. Trend: UTrend,
- (Intermediate-Term) 2. HiLo Trend: DTrend,
- 3. Pvt. Evolve: Pvt High 1220.75,
- 4. Pvt. Next: Pvt Low 1180.25,
- 5. Levels R: 1533.50, 1508.00, 1480.50, 1471.25, 1426.00,
- 6. Levels S: 1172.25, 1156.00, 1082.50, 1068.50, 1060.25.
Daily Benchmarks
- (Short-Term) 5 Day: 1202.50 Down Trend,
- (Short-Term) 10 Day: 1205.25 Down Trend,
- (Intermediate-Term) 20 Day: 1203.00 Down Trend,
- (Intermediate-Term) 55 Day: 1188.00 Up Trend,
- (Long-Term) 100 Day: 1162.75 Up Trend,
- (Long-Term) 200 Day: 1138.00 Up Trend.
Additional Metrics
Recent Trade Signals
- 26 May 2026: Short ZS 07-26 @ 1186.75 Signals.USAR-WSFG
- 26 May 2026: Short ZS 07-26 @ 1189.25 Signals.USAR-MSFG
- 20 May 2026: Short ZS 07-26 @ 1197.5 Signals.USAR.TR120
Overall Rating
- Short-Term: Bearish,
- Intermediate-Term: Bearish,
- Long-Term: Bullish.
Key Insights Summary
Soybeans are trading in a mixed but still structurally divided tape: short-term pressure remains heavy as price sits below the 5/10/20-day benchmarks and under both weekly and monthly session fib grids, while the pivot sequence still favors a short-term upside evolution at the latest swing high/low turn. The intermediate picture is softer, with the HiLo trend down and price spending time below the monthly NTZ center, reflecting a failed recovery attempt and continued range-to-down bias. Longer term, the 100- and 200-day benchmarks remain well below price, keeping the broader yearly structure constructive even after the recent pullback from the 1220-1254 resistance zone. The chart shows a volatile swing environment with sharp impulsive rallies and retracements, repeated inside-bar consolidation, and rejection near overhead supply, leaving a short-term bearish, intermediate-term bearish, and long-term bullish read.
Chart Analysis ATS AI Generated: 2026-05-26 07:10 for Informational use only, not trading advice. Terms and Risk Disclosure Copyright © 2026. Algo Trading Systems LLC.