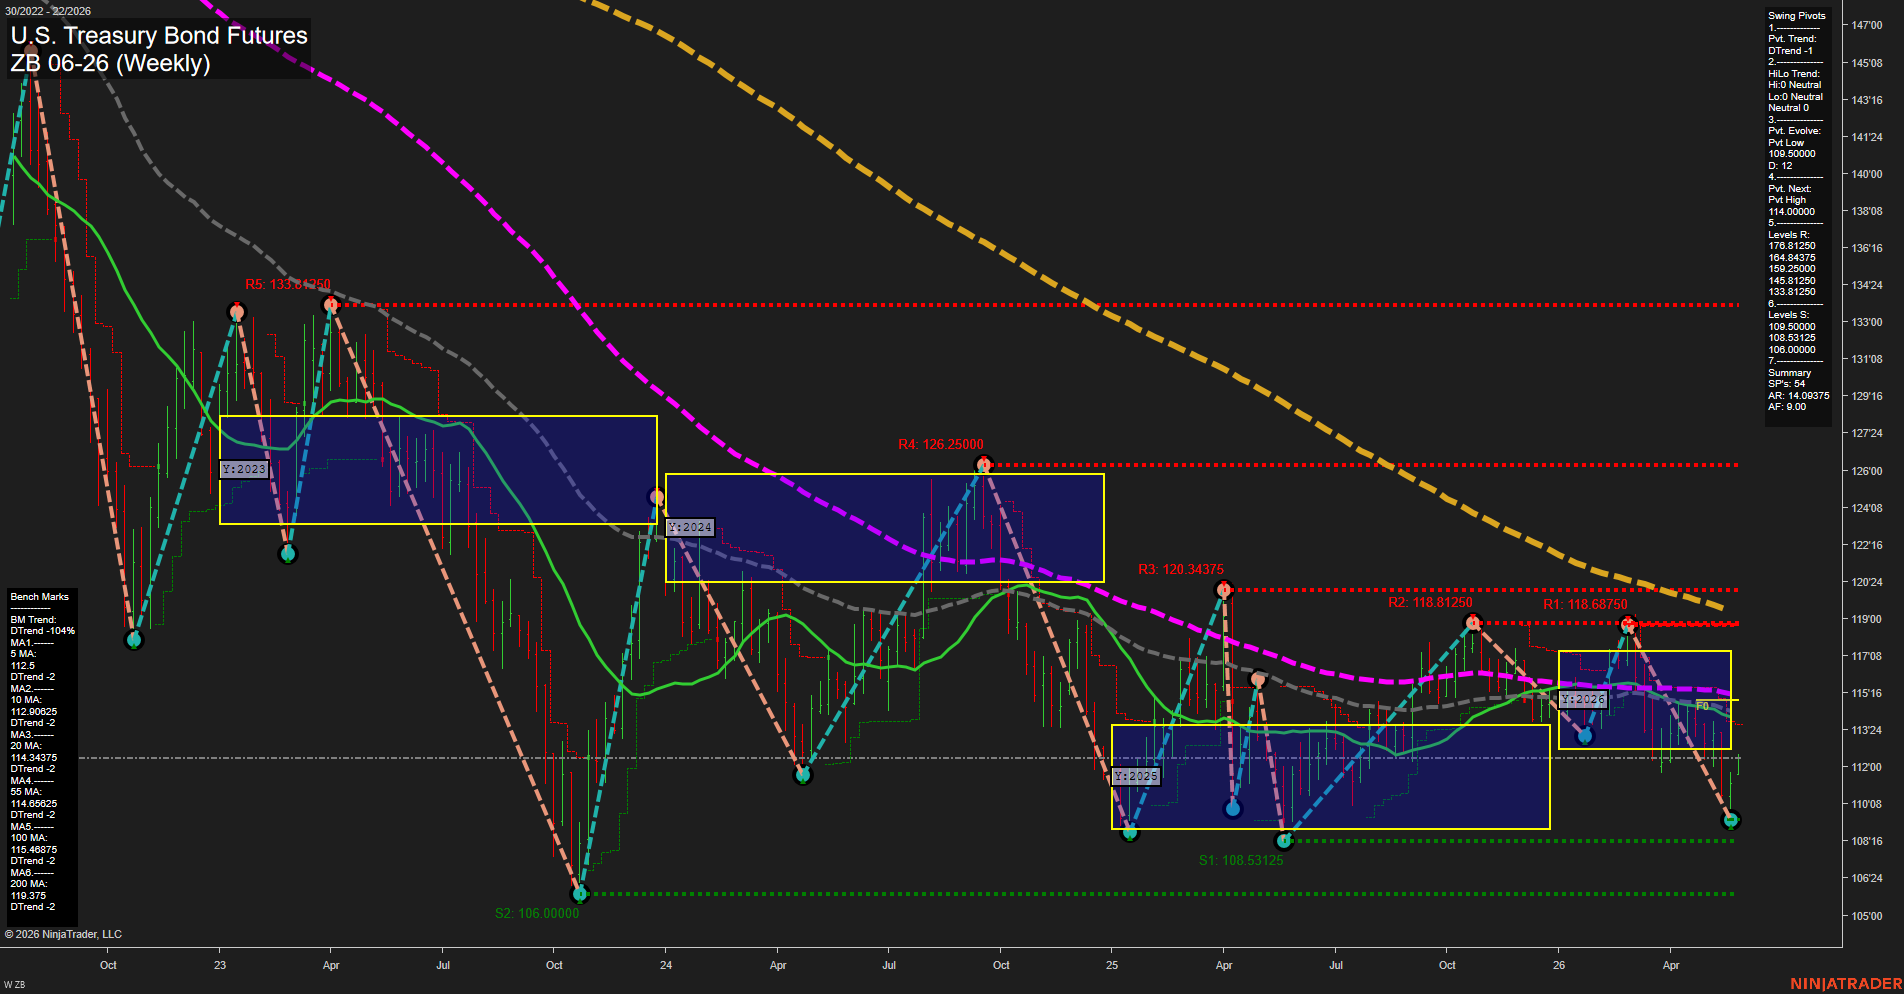
ZB U.S. Treasury Bond Futures Weekly Chart Analysis: 2026-May-26 07:09 CT
Price Action
- Last: 112.00,
- Bars: Medium,
- Mom: slow.
WSFG Weekly
- Short-Term
- WSFG Current: NA%
- F0%/NTZ' Bias: Price Neutral,
- WSFG Trend: Neutral.
MSFG Month May
- Intermediate-Term
- MSFG Current: NA%
- F0%/NTZ' Bias: Price Neutral,
- MSFG Trend: Neutral.
YSFG Year 2026
- Long-Term
- YSFG Current: NA%
- F0%/NTZ' Bias: Price Neutral,
- YSFG Trend: Neutral.
Swing Pivots
- (Short-Term) 1. Pvt. Trend: DTrend,
- (Intermediate-Term) 2. HiLo Trend: DTrend,
- 3. Pvt. Evolve: Pvt Low 109.50000,
- 4. Pvt. Next: Pvt High 114.00000,
- 5. Levels R: 176.81250, 164.84375, 159.25000, 145.81250, 133.81250, 126.25000, 120.34375, 118.81250, 118.68750,
- 6. Levels S: 109.50000, 108.53125, 106.00000.
Weekly Benchmarks
- (Short-Term) 5 Day: 112.50000 Down Trend,
- (Short-Term) 10 Day: 112.90625 Down Trend,
- (Intermediate-Term) 20 Day: 114.34375 Down Trend,
- (Intermediate-Term) 55 Day: 114.65625 Down Trend,
- (Long-Term) 100 Day: 115.46875 Down Trend,
- (Long-Term) 200 Day: 119.37500 Down Trend.
Overall Rating
- Short-Term: Bearish,
- Intermediate-Term: Bearish,
- Long-Term: Bearish.
Key Insights Summary
The weekly structure remains in a broad downtrend with a sequence of lower highs and lower lows, and the pivot framework is still aligned with downside dominance. Price is trading beneath the full stack of benchmark moving averages, with every major average sloping lower, confirming persistent long-duration weakness. The 2026 yearly session is sitting in the lower portion of its NTZ range, while the current weekly and monthly session grids remain centered in a neutral-to-lower posture rather than showing a clear expansion higher. Recent pivot structure shows the market working off a low near 109.50 with the next pivot objective marked at 114.00, but the broader tape still reflects a compressed, corrective recovery inside a larger bearish cycle.
Chart Analysis ATS AI Generated: 2026-05-26 07:09 for Informational use only, not trading advice. Terms and Risk Disclosure Copyright © 2026. Algo Trading Systems LLC.