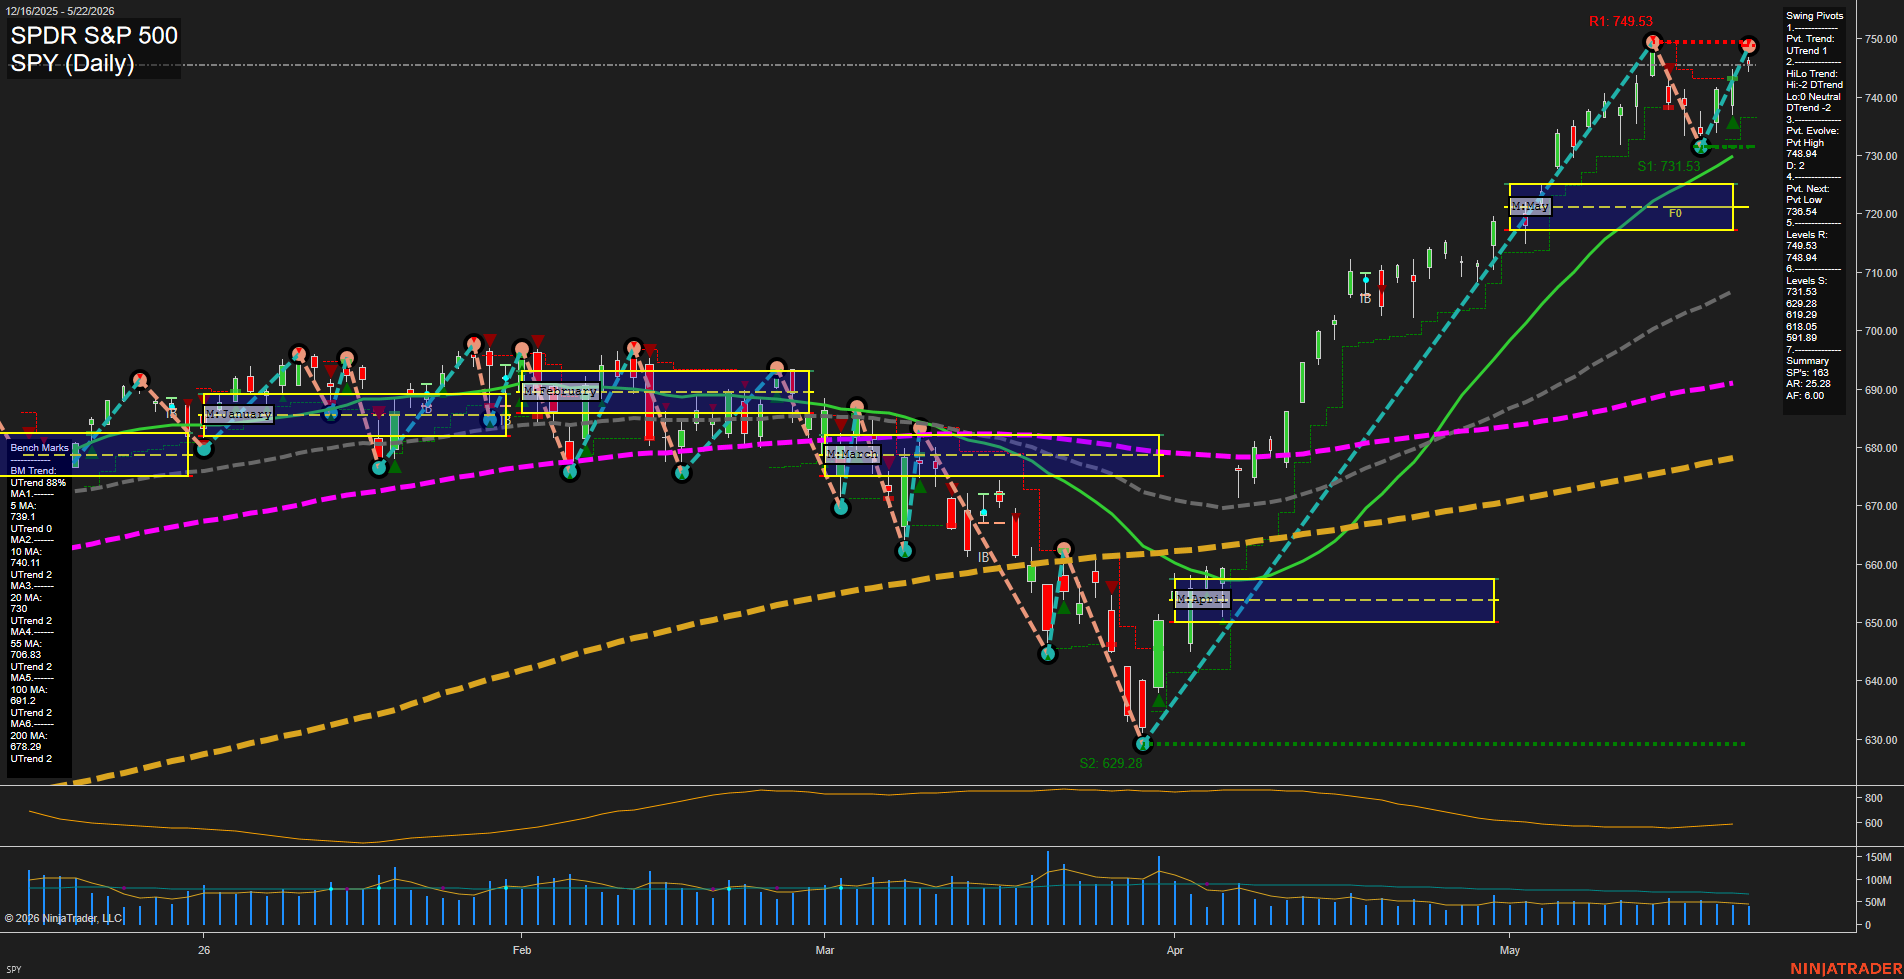
SPY SPDR S&P 500 Daily Chart Analysis: 2026-May-26 07:07 CT
Price Action
- Last: 749.53,
- Bars: Large,
- Mom: fast.
WSFG Weekly
- Short-Term
- WSFG Current: NA%
- F0%/NTZ' Bias: Price Neutral,
- WSFG Trend: Neutral.
MSFG Month May
- Intermediate-Term
- MSFG Current: NA%
- F0%/NTZ' Bias: Price Neutral,
- MSFG Trend: Neutral.
YSFG Year 2026
- Long-Term
- YSFG Current: NA%
- F0%/NTZ' Bias: Price Neutral,
- YSFG Trend: Neutral.
Swing Pivots
- (Short-Term) 1. Pvt. Trend: UTrend,
- (Intermediate-Term) 2. HiLo Trend: DTrend,
- 3. Pvt. Evolve: Pvt high 748.94,
- 4. Pvt. Next: Pvt low 738.54,
- 5. Levels R: 749.53, 748.94,
- 6. Levels S: 731.53, 629.28, 619.29, 618.05, 591.89.
Daily Benchmarks
- (Short-Term) 5 Day: 739.1 Up Trend,
- (Short-Term) 10 Day: 740.11 Up Trend,
- (Intermediate-Term) 20 Day: 730 Up Trend,
- (Intermediate-Term) 55 Day: 706.83 Up Trend,
- (Long-Term) 100 Day: 691.2 Up Trend,
- (Long-Term) 200 Day: 678.29 Up Trend.
Additional Metrics
- ATR: 564,
- VOLMA: 47470907.
Overall Rating
- Short-Term: Bullish,
- Intermediate-Term: Bullish,
- Long-Term: Bullish.
Key Insights Summary
SPY is pressing into the upper edge of the May range with strong momentum and a clean sequence of higher highs and higher lows off the April low. Price is holding well above the 20, 55, 100, and 200 day benchmarks, which keeps the broader structure aligned to the upside. The swing pivot structure shows an active uptrend in the short-term, while the intermediate pivot geometry reflects the prior down-move and subsequent reversal leg that carried price back into overhead resistance. The current setup is a breakout and trend-extension profile, with the market trading near the prior pivot high and the top of the monthly fib zone after a sharp V-shaped recovery from the April selloff.
Chart Analysis ATS AI Generated: 2026-05-26 07:08 for Informational use only, not trading advice. Terms and Risk Disclosure Copyright © 2026. Algo Trading Systems LLC.