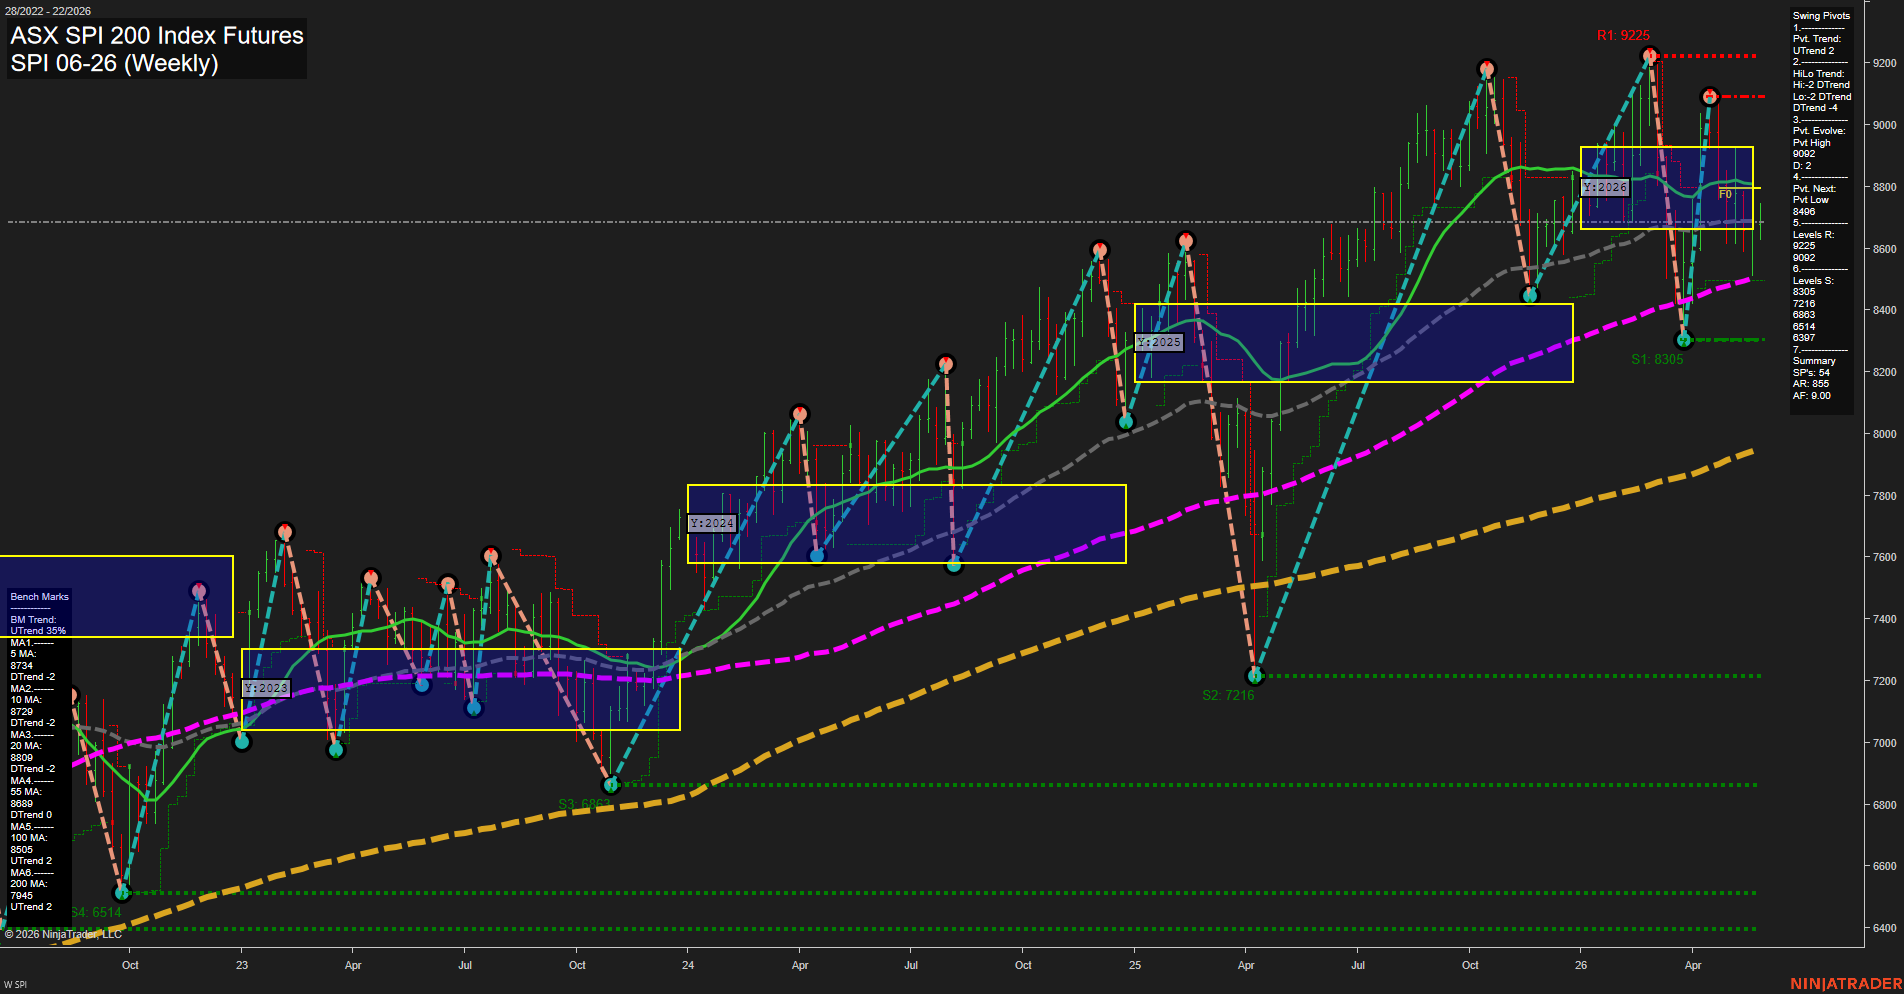
SPI ASX SPI 200 Index Futures Weekly Chart Analysis: 2026-May-26 07:07 CT
Price Action
- Last: 8700,
- Bars: Large,
- Mom: Fast.
WSFG Weekly
- Short-Term
- WSFG Current: 54%
- F0%/NTZ' Bias: Price Neutral,
- WSFG Trend: Neutral.
MSFG Month May
- Intermediate-Term
- MSFG Current: 85.5%
- F0%/NTZ' Bias: Price Neutral,
- MSFG Trend: Neutral.
YSFG Year 2026
- Long-Term
- YSFG Current: 9.00%
- F0%/NTZ' Bias: Price Neutral,
- YSFG Trend: Neutral.
Swing Pivots
- (Short-Term) 1. Pvt. Trend: DTrend,
- (Intermediate-Term) 2. HiLo Trend: DTrend,
- 3. Pvt. Evolve: Pvt High 9092,
- 4. Pvt. Next: Pvt Low 8496,
- 5. Levels R: 9225, 9092,
- 6. Levels S: 8305, 7216, 6883, 6514, 6397.
Weekly Benchmarks
- (Short-Term) 5 Day: 8734 Down Trend,
- (Short-Term) 10 Day: 8729 Down Trend,
- (Intermediate-Term) 20 Day: 8809 Down Trend,
- (Intermediate-Term) 55 Day: 8689 Down Trend,
- (Long-Term) 100 Day: 8505 Up Trend,
- (Long-Term) 200 Day: 7945 Up Trend.
Overall Rating
- Short-Term: Neutral,
- Intermediate-Term: Neutral,
- Long-Term: Bullish.
Key Insights Summary
Weekly price is positioned back inside the yearly NTZ after a sharp selloff-and-rebound sequence, leaving the market in a recovery phase rather than a clean directional breakout. The short-term swing structure remains DTrend with the next pivot defined lower at 8496, while resistance is stacked overhead at 9092 and 9225. Benchmarks show the faster averages still rolling lower, but the major 100-day and 200-day measures remain in uptrend mode, which keeps the larger structure constructive despite the recent volatility. Overall, the chart reads as a broad, multi-year advance with a current corrective swing and choppy weekly behavior around the midpoint of the yearly range.
Chart Analysis ATS AI Generated: 2026-05-26 07:07 for Informational use only, not trading advice. Terms and Risk Disclosure Copyright © 2026. Algo Trading Systems LLC.