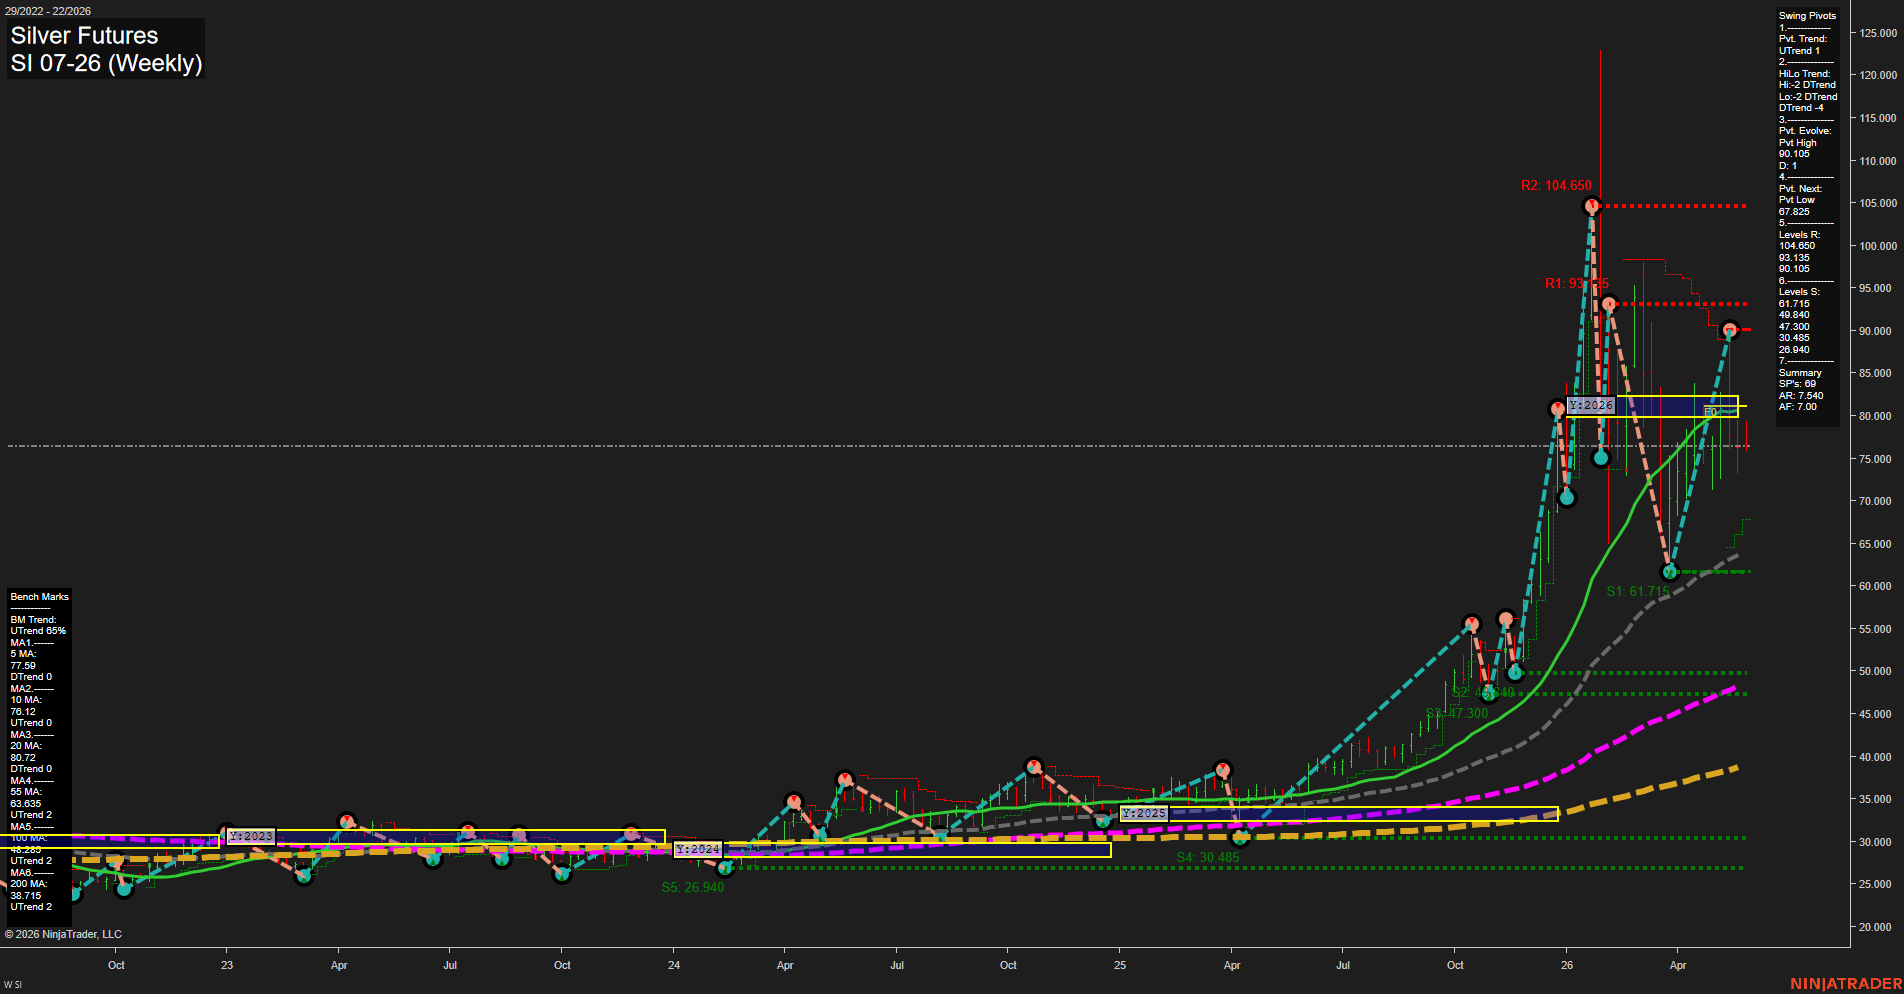
SI Silver Futures Weekly Chart Analysis: 2026-May-26 07:07 CT
Price Action
- Last: 78.1,
- Bars: Large,
- Mom: Average.
WSFG Weekly
- Short-Term
- WSFG Current: -5%
- F0%/NTZ' Bias: Price Below,
- WSFG Trend: Down.
MSFG Month May
- Intermediate-Term
- MSFG Current: 5%
- F0%/NTZ' Bias: Price Above,
- MSFG Trend: Up.
YSFG Year 2026
- Long-Term
- YSFG Current: -39%
- F0%/NTZ' Bias: Price Below,
- YSFG Trend: Down.
Swing Pivots
- (Short-Term) 1. Pvt. Trend: UTrend,
- (Intermediate-Term) 2. HiLo Trend: DTrend,
- 3. Pvt. Evolve: Pvt High 90.105,
- 4. Pvt. Next: Pvt Low 67.825,
- 5. Levels R: 104.650, 93.135, 90.105,
- 6. Levels S: 61.715, 49.840, 47.300, 30.485, 26.940.
Weekly Benchmarks
- (Short-Term) 5 Day: 77.59 Up Trend,
- (Short-Term) 10 Day: 76.12 Up Trend,
- (Intermediate-Term) 20 Day: 80.72 Up Trend,
- (Intermediate-Term) 55 Day: 63.635 Up Trend,
- (Long-Term) 100 Day: 48.259 Up Trend,
- (Long-Term) 200 Day: 38.715 Up Trend.
Recent Trade Signals
- 25 May 2026: Long SI 07-26 @ 78.1 Signals.USAR-MSFG
- 25 May 2026: Long SI 07-26 @ 78.1 Signals.USAR-WSFG
- 25 May 2026: Long SI 07-26 @ 78.575 Signals.USAR.TR120
Overall Rating
- Short-Term: Neutral,
- Intermediate-Term: Bullish,
- Long-Term: Bearish.
Key Insights Summary
Silver has transitioned from a long base-building phase into a powerful 2026 vertical expansion, with the weekly structure still holding above the 2025/2026 breakout zone despite the sharp retreat from the 104.650 pivot high. Price is now trading back below the yearly F0% area and beneath the 20-week benchmark, which keeps the long-term backdrop defensive even as the monthly grid remains constructive and above its NTZ centerline. The swing pivot profile still shows an active short-term uptrend, but the higher-timeframe HiLo structure has rolled to downtrend, reflecting a completed impulse and a current digestion phase. The chart is consolidating between the upper-70s and low-90s, with layered support clustered around 61.715, 49.840, and 47.300, while resistance is defined by 90.105, 93.135, and 104.650. Recent USAR long signals show the market is trying to stabilize near the weekly grid boundary after the pullback, but the broader setup remains a transition from breakout momentum into a volatile consolidation zone.
Chart Analysis ATS AI Generated: 2026-05-26 07:07 for Informational use only, not trading advice. Terms and Risk Disclosure Copyright © 2026. Algo Trading Systems LLC.