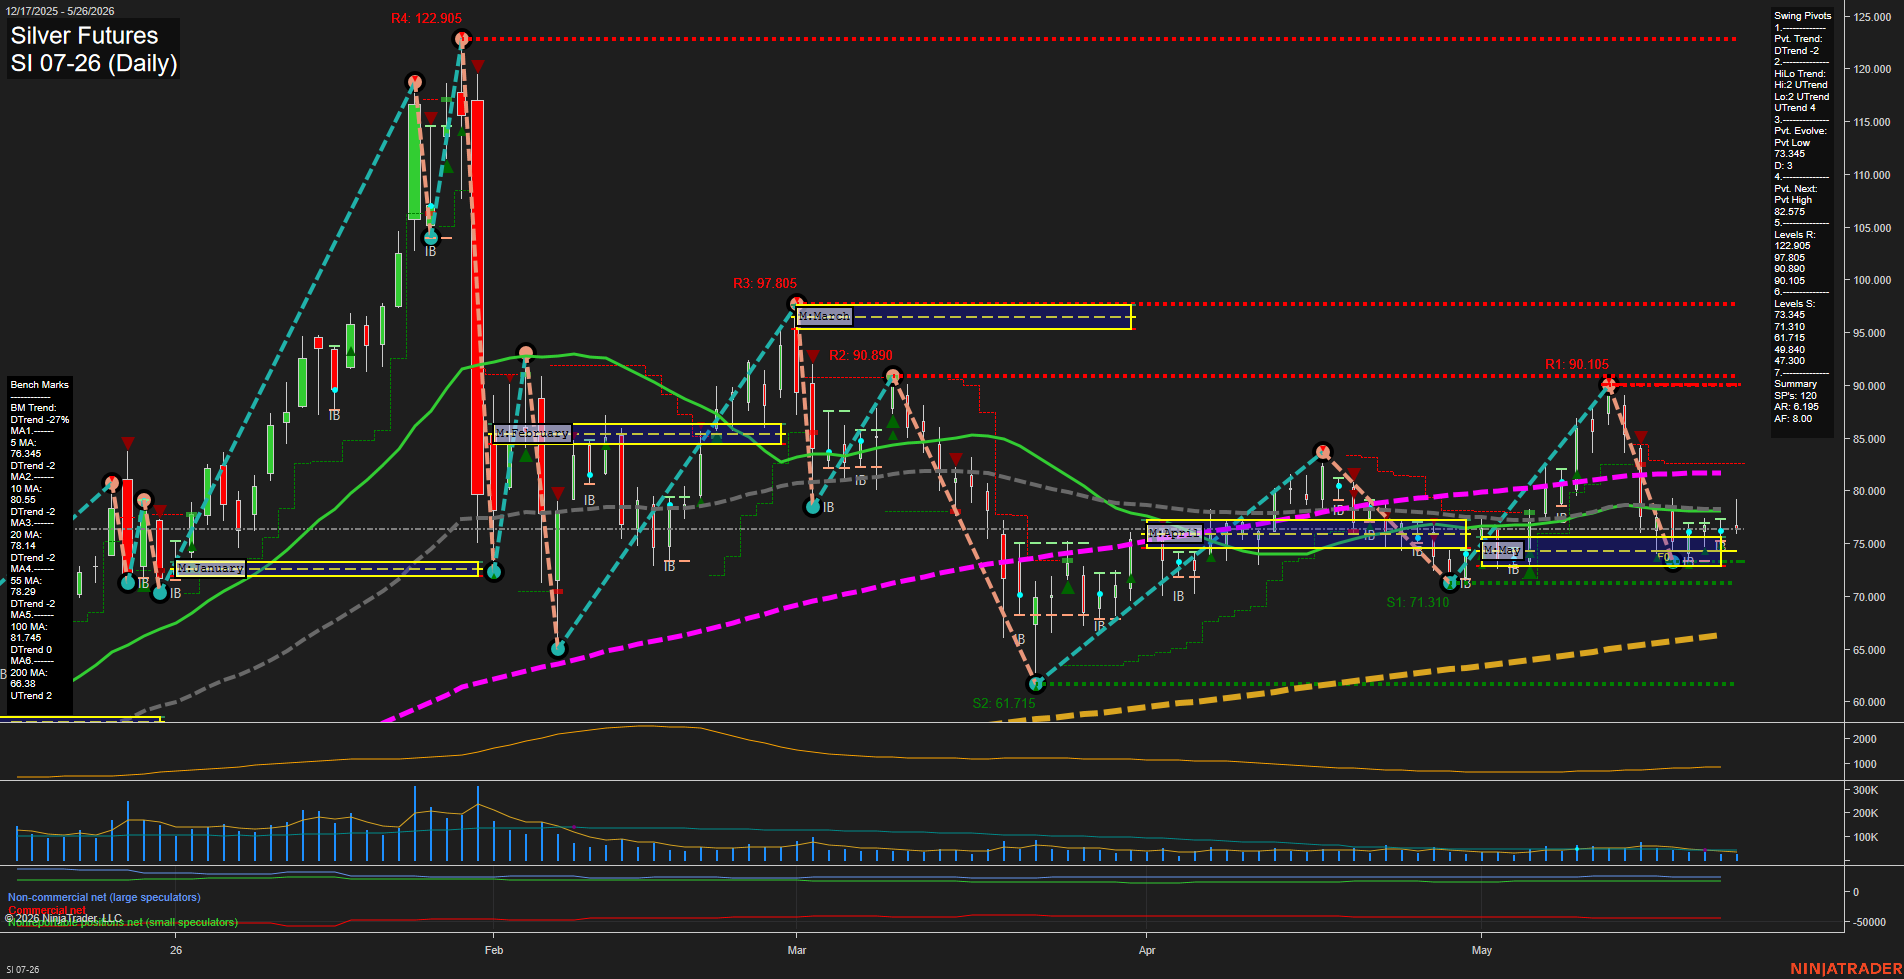
SI Silver Futures Daily Chart Analysis: 2026-May-26 07:07 CT
Price Action
- Last: 75.0,
- Bars: Medium,
- Mom: Average.
WSFG Weekly
- Short-Term
- WSFG Current: -5%
- F0%/NTZ' Bias: Price Below,
- WSFG Trend: Down.
MSFG Month May
- Intermediate-Term
- MSFG Current: 5%
- F0%/NTZ' Bias: Price Above,
- MSFG Trend: Up.
YSFG Year 2026
- Long-Term
- YSFG Current: -39%
- F0%/NTZ' Bias: Price Below,
- YSFG Trend: Down.
Swing Pivots
- (Short-Term) 1. Pvt. Trend: DTrend,
- (Intermediate-Term) 2. HiLo Trend: UTrend,
- 3. Pvt. Evolve: Pvt Low 73.345,
- 4. Pvt. Next: Pvt High 82.575,
- 5. Levels R: 122.905, 97.805, 90.890, 90.105,
- 6. Levels S: 73.345, 71.310, 61.715, 49.840, 47.300.
Daily Benchmarks
- (Short-Term) 5 Day: 76.345 Down Trend,
- (Short-Term) 10 Day: 80.55 Down Trend,
- (Intermediate-Term) 20 Day: 78.14 Down Trend,
- (Intermediate-Term) 55 Day: 78.29 Down Trend,
- (Long-Term) 100 Day: 81.745 Down Trend,
- (Long-Term) 200 Day: 68.83 Up Trend.
Additional Metrics
Recent Trade Signals
- 25 May 2026: Long SI 07-26 @ 78.1 Signals.USAR-MSFG
- 25 May 2026: Long SI 07-26 @ 78.1 Signals.USAR-WSFG
- 25 May 2026: Long SI 07-26 @ 78.575 Signals.USAR.TR120
Overall Rating
- Short-Term: Bearish,
- Intermediate-Term: Neutral,
- Long-Term: Bearish.
Key Insights Summary
Silver is trading in a lower-price consolidation after a sharp spring decline from the 90s and a failed push toward the 97.805 resistance zone, with the current structure still defined by a DTrend pivot regime and price below the key short- and intermediate-term benchmarks. The weekly fib grid remains negative and below F0%, while the monthly fib grid is still positive, showing a mixed tape where the monthly recovery attempt is holding above its center line but has not fully repaired the broader damage. Swing pivots place near-term resistance overhead at 82.575 with layered resistance at 90.105 and 90.890, while support sits first at 73.345 and then 71.310, making the current area a compressed transition zone after the prior impulse swings. The benchmark stack shows the 5, 10, 20, 55, and 100 day averages all trending down, with only the 200 day still rising, which keeps the daily structure tilted bearish despite the longer-cycle floor remaining intact. Volume and ATR reflect a market that has already experienced a large volatility event and is now digesting that move in a sideways-to-down drift, with recent trade signals still showing an active long framework from the monthly and weekly session fib systems even as price action remains beneath the short-term trend shelf.
Chart Analysis ATS AI Generated: 2026-05-26 07:07 for Informational use only, not trading advice. Terms and Risk Disclosure Copyright © 2026. Algo Trading Systems LLC.